Generic selectors
Exact matches only
Search in title
Search in content
Post Type Selectors

Popular stocks

Crypto

CFD

Currencies

Support

Gold

AUD/USD – Technical Analysis – 4h

September 18, 2025 07:08

Quick Summary

The asset’s chart reveals a recent transition from a bullish to a bearish trend, highlighted by significant price movements.

Key indicators like MACD and volume suggest potential continued bearish momentum.

Investors are advised to keep a close watch on critical support and resistance levels for future opportunities.

Candlestick Analysis

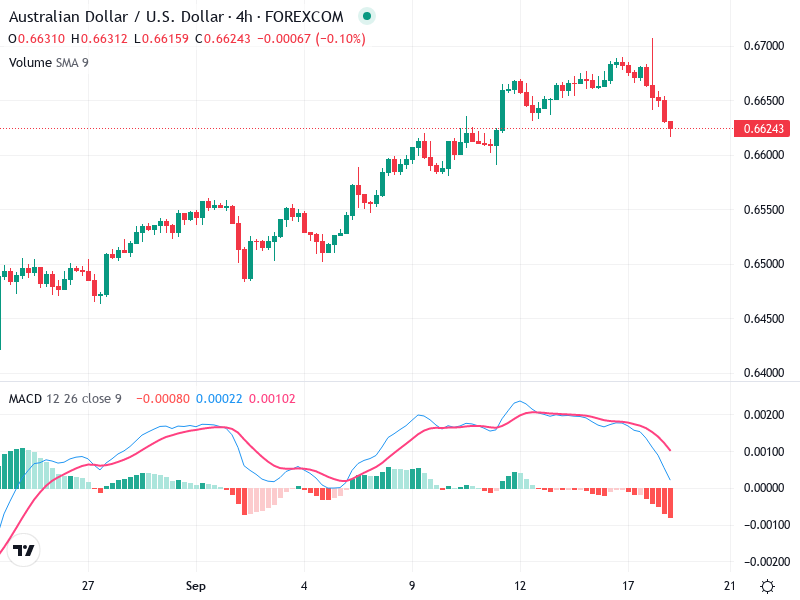
The recent candlestick patterns show a noticeable pullback following an earlier uptrend. There's a combination of bearish candlesticks, though no distinct pattern like a bearish engulfing has formed.

Previously bullish, transitioning to a bearish trend with recent downward movements.

The price broke past a previous resistance zone around 0.66500, moving downwards, indicating a potential pullback.

MACD Analysis

The MACD line is below the Signal line, signaling a bearish crossover, which indicates potential continued downward momentum.

The histogram is negative and expanding, reinforcing the bearish sentiment and the increased momentum to the downside.

No clear divergence observed between MACD and price action at this moment.

Volume Analysis

There was a significant spike in volume around the recent peak, suggesting possible distribution by larger players or institutions.

The high volume on the price dip supports the current bearish movement, indicating stronger seller interest.

Noticeable spike coinciding with the top, which could imply potential institutional involvement in the trend reversal.

Support & Resistance

Near-term support is around the 0.66000 level, where the price may stabilize temporarily.

Resistance is now at the recently broken 0.66500 level, which could serve as a retesting point for any potential recovery attempts.

Monitoring reactions at these key levels will give insight into future price movements.

Actionable Insights

Consider a cautious approach for selling or shorting, given the confirmed downtrend and MACD crossover.

Watch for signs of stabilization around the support level for potential buying opportunities if confirmed by other indicators.

Monitor for changes in volume patterns that could indicate reversal or continuation.

The AI Technical Analysis Center is an informational tool only and does not constitute investment or trading advice.
This site is registered on wpml.org as a development site. Switch to a production site key to remove this banner.