Generic selectors
Exact matches only
Search in title
Search in content
Post Type Selectors

Popular stocks

Crypto

CFD

Currencies

Support

Gold

NSDQ – Technical Analysis – 4h

September 22, 2025 07:00

Quick Summary

The chart for reveals a robust uptrend, supported by technical indicators.

Recent price movements suggest strong market sentiment.

Investors should stay vigilant for possible breakout scenarios.

Candlestick Analysis

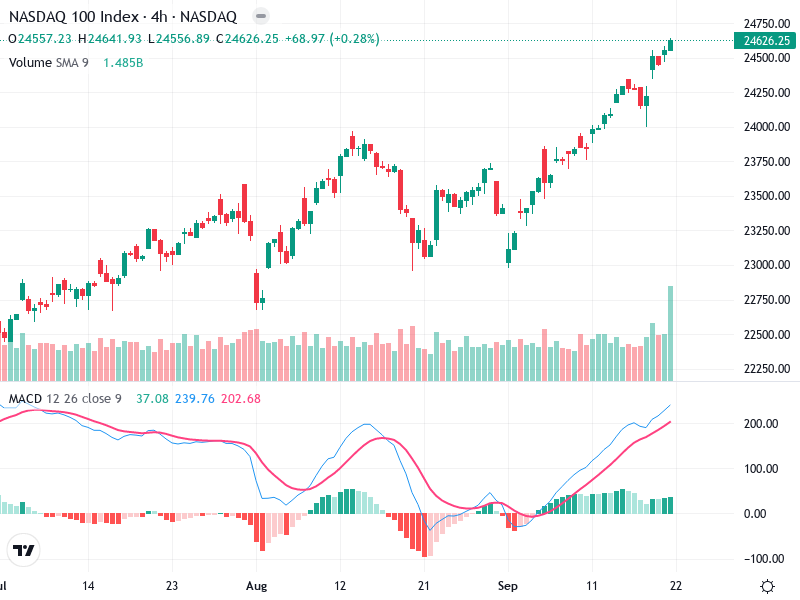
The overall trend appears to be bullish, especially with the recent series of higher highs and higher lows.

There are no distinct reversal patterns like a doji or bearish engulfing candlestick visible at the top, which suggests continuation of the uptrend for now.

The recent highs around 24,750 form a potential breakout zone. The price closing above this level could indicate further bullish momentum.

MACD Analysis

The MACD line is above the Signal line, indicating bullish momentum.

The MACD histogram is positive and growing, reinforcing the bullish sentiment. The increasing distance between the MACD and Signal line suggests strengthening momentum.

No visible divergences between the MACD and price action are noted, further supporting the current trend direction.

Volume Analysis

There is a significant increase in volume accompanying the recent price increase, which supports the bullish breakout scenario.

The spike in volume suggests potential institutional buying, often a strong indicator of continued movement in the trend direction.

This volume profile aligns with the apparent bullish sentiment.

Support & Resistance

The next resistance is around 24,750. Breaking above this could lead to further upward movement.

Key support is around the 24,000 level, previously tested during price pullbacks.

Traders should monitor these levels closely for any potential bounce or breakout scenarios.

Actionable Insights

Consider entering long positions if the price breaks and holds above the 24,750 resistance with sustained volume.

Implement stop-loss orders just below the 24,000 support level to minimize risk.

Watch for any reversal patterns or MACD signal line crossovers that might suggest weakening momentum.

The AI Technical Analysis Center is an informational tool only and does not constitute investment or trading advice.
This site is registered on wpml.org as a development site. Switch to a production site key to remove this banner.