Generic selectors
Exact matches only
Search in title
Search in content
Post Type Selectors

Popular stocks

Crypto

CFD

Currencies

Support

Gold

NSDQ – Technical Analysis – 4h

September 23, 2025 07:01

Quick Summary

The NASDAQ 100 Index chart shows a strong upward trend, supported by various technical indicators. The asset has been experiencing a bullish momentum as reflected in the recent price movements.

It is crucial to watch key levels as the market progresses to gauge the sustainability of the current trend.

Candlestick Analysis

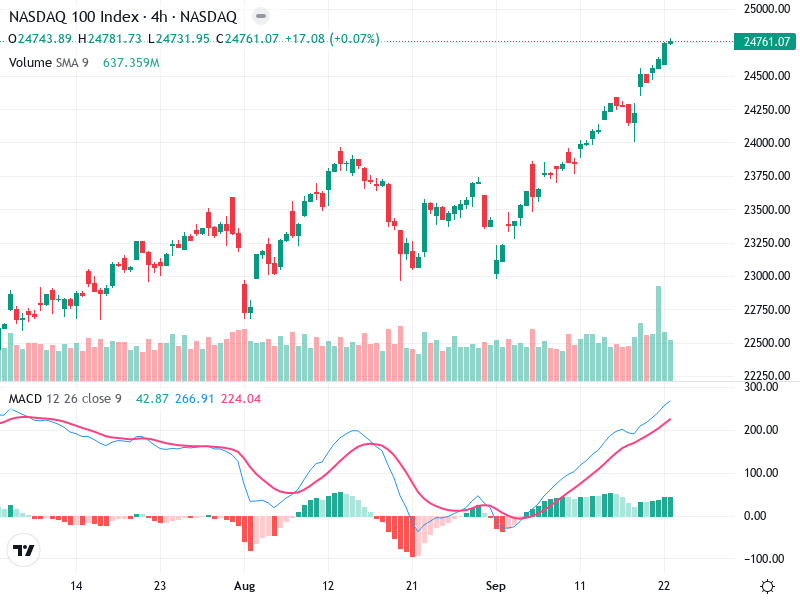
The chart shows a clear bullish trend with a series of green candlesticks forming higher highs and higher lows, particularly noticeable in the recent sessions.

Recently, no prominent reversal patterns like doji or hammer are present; however, the persistence of green candlesticks suggests strong bullish sentiment.

The current price is near a potential breakout zone beyond the previous highs around 24,750, suggesting continued upward momentum if this level holds.

MACD Analysis

The MACD line is significantly above the Signal line, indicating a bullish crossover that supports the ongoing upward trend.

The MACD histogram is in positive territory and expanding, suggesting building bullish momentum.

There are no visible bearish divergences; the MACD aligns well with the upward price movement.

Volume Analysis

There’s a notable increase in volume accompanying the recent upward move, which generally confirms the price action.

A spike in volume suggests possible institutional buying interest, supporting the bullish outlook.

Increasing volume in line with price increases typically confirms the strength of the trend.

Support & Resistance

Key support can be identified around 23,500, where the price consolidated before the recent breakout.

Immediate resistance is around the previous highs (24,750), and a sustained move above this level could validate the continuation of the uptrend.

The ability of the price to sustain above resistance levels will be critical for further bullish movement.

Actionable Insights

Consider buying if the price breaks and holds above the current resistance level of 24,750, with a stop loss below the nearest support at 23,500.

For existing positions, maintain holdings with a watchful eye on volume and MACD for any bearish divergences or reversals.

Confirmation of the breakout with increased volume and continued MACD bullishness as indicators for sustained upward moves.

The AI Technical Analysis Center is an informational tool only and does not constitute investment or trading advice.
This site is registered on wpml.org as a development site. Switch to a production site key to remove this banner.