Generic selectors
Exact matches only
Search in title
Search in content
Post Type Selectors

Popular stocks

Crypto

CFD

Currencies

Support

Gold

NZD/USD – Technical Analysis – 4h

September 23, 2025 12:00

Quick Summary

The NZD/USD 4-hour chart highlights potential price movements.

Recent analysis suggests a mix of trends and patterns worth monitoring.

Market participants should closely watch key levels for actionable insights.

Candlestick Analysis

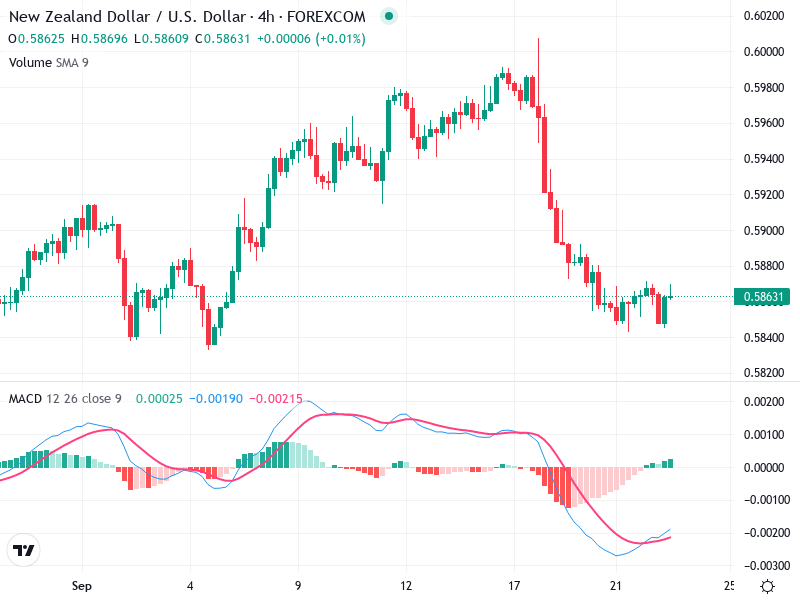
The chart reflects a recent bearish trend, as seen in the decline from mid-September.

There is a potential for a bullish reversal pattern, such as a hammer or similar formation, near the end as the candlesticks show long lower wicks indicating buying pressure.

Prices appear to have found some support around the 0.5860 level, suggesting potential for a pullback or sideways movement.

MACD Analysis

There's a recent bullish crossover where the MACD line is above the Signal line, indicating potential bullish momentum.

The MACD histogram is currently moving from negative towards zero, suggesting decreasing bearish momentum and a possible uptrend initiation.

There isn't a clear divergence between the MACD and price action at this time.

Volume Analysis

Volume appears to have decreased, which is typical as price consolidates after a significant move.

The current volume doesn't strongly support a breakout, indicating traders might be cautious.

If volume increases with price moving upwards, it may suggest stronger interest and conviction in a reversal.

Support & Resistance

Around 0.5860, where there is buying support as indicated by candlestick patterns.

Previous highs around 0.5920 could pose resistance if price attempts to rebound.

Traders should closely monitor these levels for potential market reactions.

Actionable Insights

Consider entering a long position if bullish momentum persists and breaks above resistance with increased volume.

If the price fails to hold above 0.5860 and bearish MACD crossover occurs, a short position might be warranted.

Monitor for confirmation of reversal or continuation patterns.

The AI Technical Analysis Center is an informational tool only and does not constitute investment or trading advice.
This site is registered on wpml.org as a development site. Switch to a production site key to remove this banner.