Generic selectors
Exact matches only
Search in title
Search in content
Post Type Selectors

Popular stocks

Crypto

CFD

Currencies

Support

Gold

NSDQ – Technical Analysis – 4h

September 24, 2025 07:00

Quick Summary

The asset exhibits a strong uptrend on the chart with recent highs pointing to bullish sentiment. Current candlestick patterns suggest potential short-term reversals. Price actions around key resistance levels are crucial in the coming sessions.

Candlestick Analysis

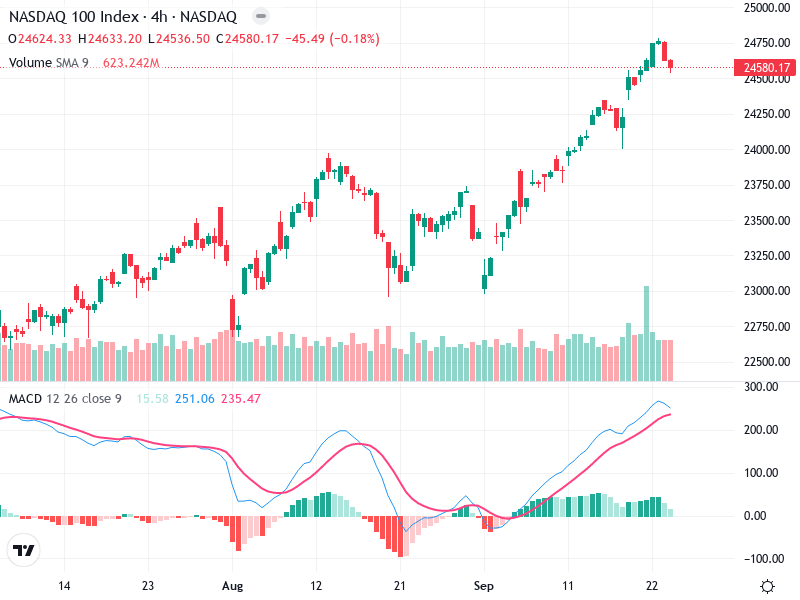
The chart shows a strong recent uptrend, with higher highs and higher lows, indicating a bullish market sentiment.

There is a potential bearish engulfing pattern near the latest candlestick, which may suggest a short-term reversal or consolidation.

A recent breakout above 24,500 suggests bullish momentum, though the latest candlestick indicates potential resistance around 24,750.

MACD Analysis

The MACD line is above the Signal line, which is a bullish indicator. However, the lines are converging, signaling a potential weakening of momentum.

The histogram is decreasing, suggesting that the bullish momentum is slowing down.

No significant divergence observed between MACD and price action.

Volume Analysis

There is an increase in volume during the latest uptrend, supporting the price movement. However, the recent decrease may indicate exhaustion.

The sharp volume spike suggests possible institutional buying, aligning with the price increase.

No significant contradictions, but watch for volume decreases as potential warning signs of a reversal.

Support & Resistance

Key support is around 24,250, where previous consolidation occurred.

The current resistance is near 24,750, as indicated by the latest attempt to break through.

Watch these levels closely for price action that could indicate a shift in trend.

Actionable Insights

Consider buying on pullbacks to the 24,250 support level, provided the overall trend remains bullish.

Evaluate selling or taking profits around 24,750 unless there is a clear breakout with volume.

Holding is advised if the price stays within this range without breaking key levels.

The AI Technical Analysis Center is an informational tool only and does not constitute investment or trading advice.
This site is registered on wpml.org as a development site. Switch to a production site key to remove this banner.