Generic selectors
Exact matches only
Search in title
Search in content
Post Type Selectors

Popular stocks

Crypto

CFD

Currencies

Support

Gold

AUD/USD – Technical Analysis – 4h

September 24, 2025 12:03

Quick Summary

The AUD/USD 4-hour chart reveals hints of a changing market sentiment. Recent formations and indicators suggest potential shifts in trends. It’s essential to watch key levels for confirming a bullish outlook.

Candlestick Analysis

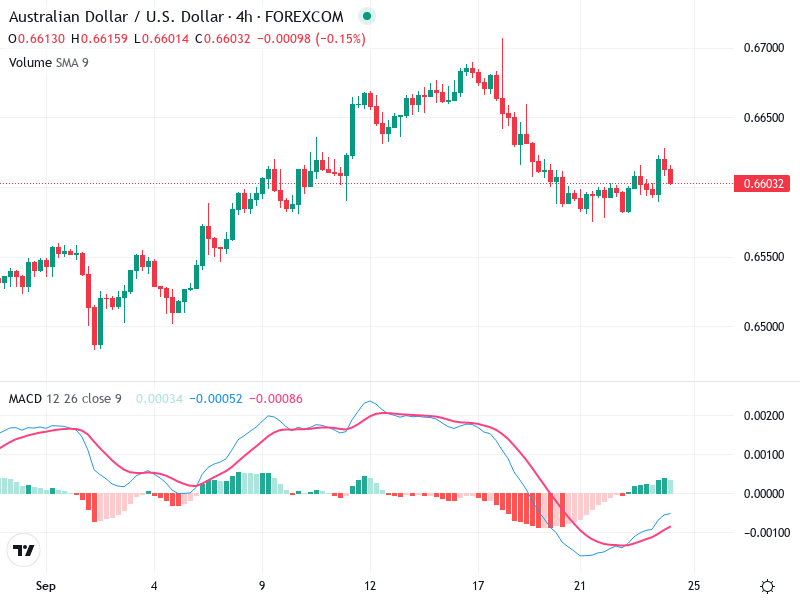
Recently, there is a potential hammer candlestick formed followed by a bullish candle. This indicates a possibility of a reversal from the downtrend.

The recent trend shows a shift from a downward move to sideways, with potential signs of a bullish reversal.

The area around 0.66500 seemed to act as a resistance during the last upward move, while 0.66000 is currently acting as a minor support level.

MACD Analysis

The MACD line is approaching the signal line from below, indicating a potential bullish crossover.

The MACD histogram is turning positive, suggesting increasing bullish momentum.

No significant divergence between MACD and price action is observed currently, indicating that MACD is confirming the current price movement.

Volume Analysis

Volume has slightly increased during the recent price recovery, supporting the bullish move.

The increase in volume accompanying the upward price movement indicates confirmation of interest at the current price level.

No significant unusual spikes suggesting institutional activity, but consistent volume support for the move.

Support & Resistance

0.66500 acts as a key resistance level that needs a breakout for continued bullish momentum.

0.66000 serves as a current support level. A break below this could indicate further downside risk.

These levels are crucial for traders to watch for potential reversals or breakout confirmations.

Actionable Insights

Potential opportunity to buy on confirmation of a bullish crossover in the MACD and sustained breakthrough above 0.66500 resistance with volume support.

Monitor for bullish confirmation through MACD crossover and continued positive histogram along with price staying above 0.66000.

A fall below 0.66000 with high volume might invalidate bullish prospects and suggest a continuation of the previous downtrend.

The AI Technical Analysis Center is an informational tool only and does not constitute investment or trading advice.
This site is registered on wpml.org as a development site. Switch to a production site key to remove this banner.