Generic selectors
Exact matches only
Search in title
Search in content
Post Type Selectors

Popular stocks

Crypto

CFD

Currencies

Support

Gold

NSDQ – Technical Analysis – 4h

September 26, 2025 07:01

Quick Summary

The recent analysis of shows interesting patterns in various technical indicators.

The chart suggests a pivotal moment as it approaches key support levels.

Understanding these indicators could guide future trading decisions on .

Candlestick Analysis

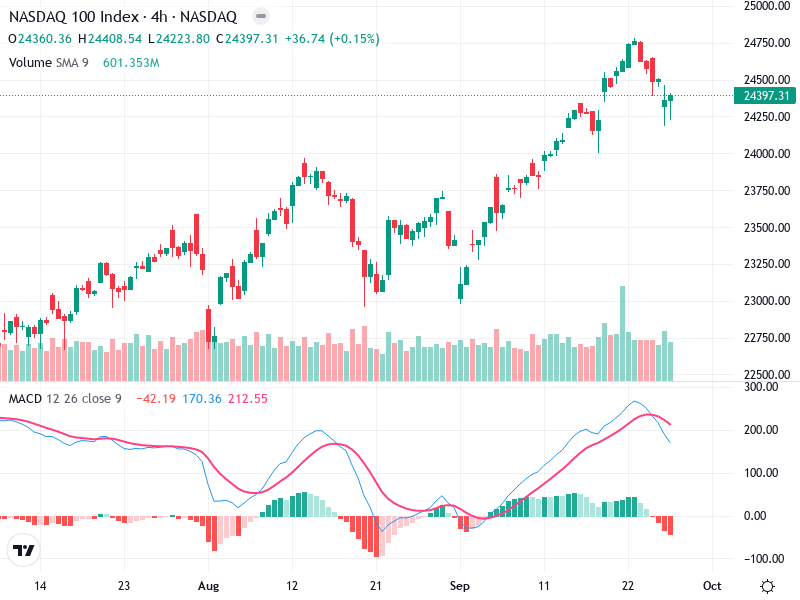
Recently, there is a formation resembling a bearish engulfing pattern near the peak, indicating a potential reversal.

The trend has shifted from bullish to a mild pullback after a strong upward move peaking around mid-September.

A recent pullback below 24,600 suggests potential testing of prior support levels.

MACD Analysis

The MACD line has crossed below the Signal line, indicating a bearish crossover.

The histogram shows increasing negative bars, suggesting a loss of bullish momentum.

No significant divergence is evident, but the bearish crossover supports the price decline.

Volume Analysis

A spike in volume accompanied the recent downward movement, pointing to strong selling pressure.

The high volume on the down days reinforces the bearish sentiment.

Suggests possible institutional activity boosting sell orders.

Support & Resistance

Key support level is around 24,200, while resistance is at recent peaks near 24,850.

Maintaining above the support level could prevent further decline.

Breaking support may lead to more bearish pressure.

Actionable Insights

Consider short positions if the price drops below 24,200 with increased volume.

If near-term support holds and bullish signals emerge, holding might be advisable.

Watch for confirmation signals like bullish candlestick patterns or a MACD rebound.

The AI Technical Analysis Center is an informational tool only and does not constitute investment or trading advice.
This site is registered on wpml.org as a development site. Switch to a production site key to remove this banner.