Generic selectors
Exact matches only
Search in title
Search in content
Post Type Selectors

Popular stocks

Crypto

CFD

Currencies

Support

Gold

EUR/USD – Technical Analysis – 4h

September 26, 2025 07:02

Quick Summary

The EUR/USD chart shows significant insights for traders. Recent price action indicates a correction phase after a previous bullish rally. The market sentiment appears to be bearish with lower lows and lower highs.

Candlestick Analysis

There is a visible bearish candlestick pattern leading to a downtrend, indicating selling pressure.

The chart shows a recent bearish trend after a bullish move. The price has pulled back significantly from its peak near 1.1900.

The recent low near 1.1650 could act as a potential support zone for a pullback. A breakout below this may lead to further downside.

MACD Analysis

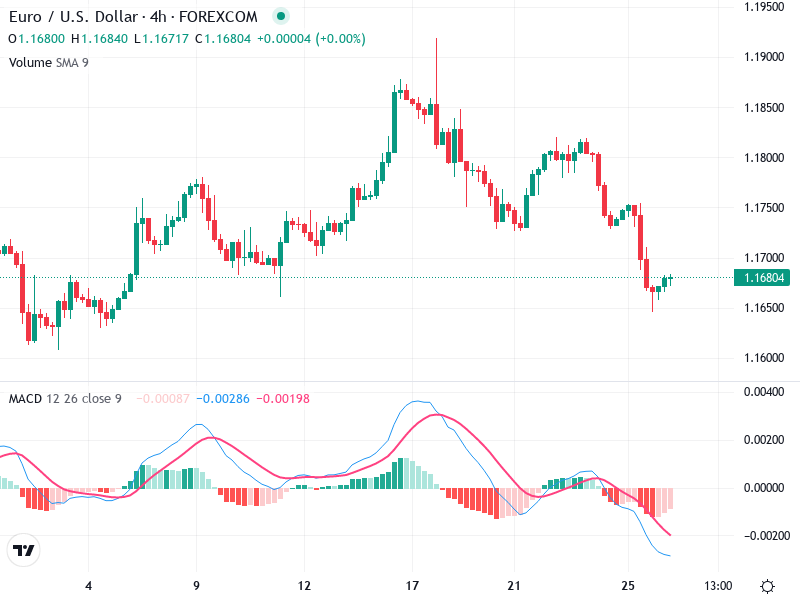
The MACD line is below the Signal line, confirming a bearish crossover, which suggests continued bearish momentum.

The histogram is negative and expanding, reinforcing the bearish trend. Look for the histogram to start contracting for potential reversal signals.

Currently no visible divergence between the MACD and price, which aligns with the current bearish trend.

Volume Analysis

Volume has trended slightly higher during the recent bearish move, supporting the downward price action.

Notable volume increases can indicate stronger selling pressure and potential institutional activity.

Unusual volume spikes should be observed for their impact on the price direction.

Support & Resistance

Key support is around 1.1650. A breakdown below this level could lead to further downside exploration.

Immediate resistance is around the 1.1750 level. A move above this could indicate a potential reversal or consolidation.

Monitoring these support and resistance levels can provide strategic points for potential entries or exits in the market.

Actionable Insights

Sell: Continuation of current bearish trend with a plan to exit positions on signs of reversal.

Watch for Reversal: Monitor for bullish reversal patterns near support levels before considering buy positions.

Watch the MACD for any reversal signals and observe the volume for any significant changes that could indicate a shift in momentum.

The AI Technical Analysis Center is an informational tool only and does not constitute investment or trading advice.
This site is registered on wpml.org as a development site. Switch to a production site key to remove this banner.