Generic selectors
Exact matches only
Search in title
Search in content
Post Type Selectors

Popular stocks

Crypto

CFD

Currencies

Support

Gold

NSDQ – Technical Analysis – 4h

September 29, 2025 07:01

Quick Summary

The recent chart depicts an interesting trend for the asset, showing potential signs of both caution and opportunity.

The analysis includes significant patterns in candlesticks, MACD movements, and volume changes.

Understanding support and resistance levels are crucial for identifying actionable insights.

Candlestick Analysis

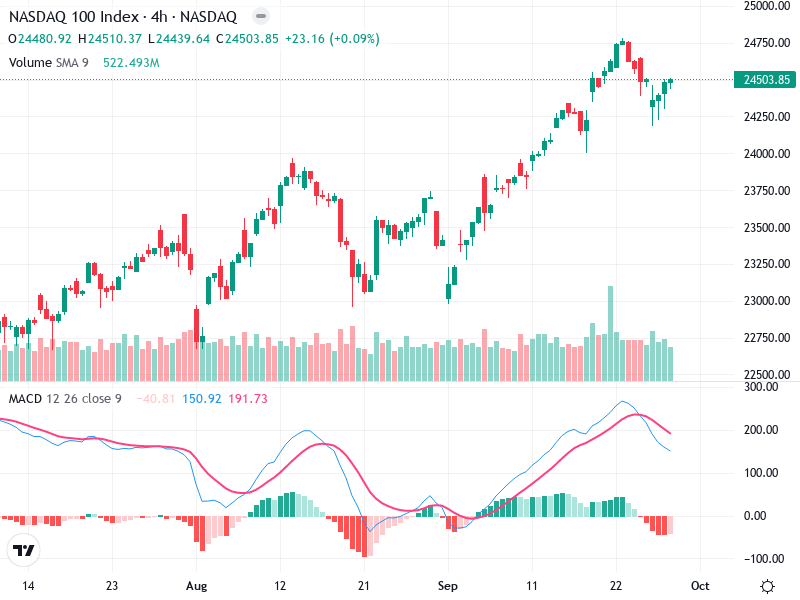
The chart shows a recent bullish candlestick following some red candles, indicating a potential reversal or a bullish continuation.

The trend appears bullish in the broader view, with a recent short-term pullback.

A breakout zone lies around the recent high (near 24,700) where resistance was tested. Support appears around 24,000.

MACD Analysis

The MACD line has crossed below the Signal line, indicating a bearish sentiment in the short term.

The histogram shows decreasing bearish momentum, suggesting a potential bottoming or reversal.

No clear divergences observed between MACD and the price action.

Volume Analysis

Volume spiked during the recent pullback, indicating strong selling pressure; however, current volume is decreasing as prices attempt to rise.

High volume during a pullback may imply strong institutional activity, supporting the recent price action.

An unusual volume spike was seen in the recent correction phase.

Support & Resistance

Key Support: Around 24,000, where previous price action bounced.

Key Resistance: Close to 24,700, where the price has previously struggled to break higher.

Understanding these levels is crucial for assessing price movements.

Actionable Insights

Consider buying if price breaks above the recent high with increased volume, confirming bullish momentum.

Watch for a confirmation of a bearish continuation if prices break below the recent support of 24,000 with high volume.

If currently holding, consider observing for the breakout above resistance or break below support before making a decision.

The AI Technical Analysis Center is an informational tool only and does not constitute investment or trading advice.
This site is registered on wpml.org as a development site. Switch to a production site key to remove this banner.