Generic selectors
Exact matches only
Search in title
Search in content
Post Type Selectors

Popular stocks

Crypto

CFD

Currencies

Support

Gold

NSDQ – Technical Analysis – 4h

October 1, 2025 07:00

Quick Summary

The asset is experiencing a strong upward trend, demonstrating consistent higher highs and higher lows.

Recently, there has been a possible consolidation phase, indicating market indecision.

Investors should watch for a breakout above the current resistance level of 24,750 for further direction.

Candlestick Analysis

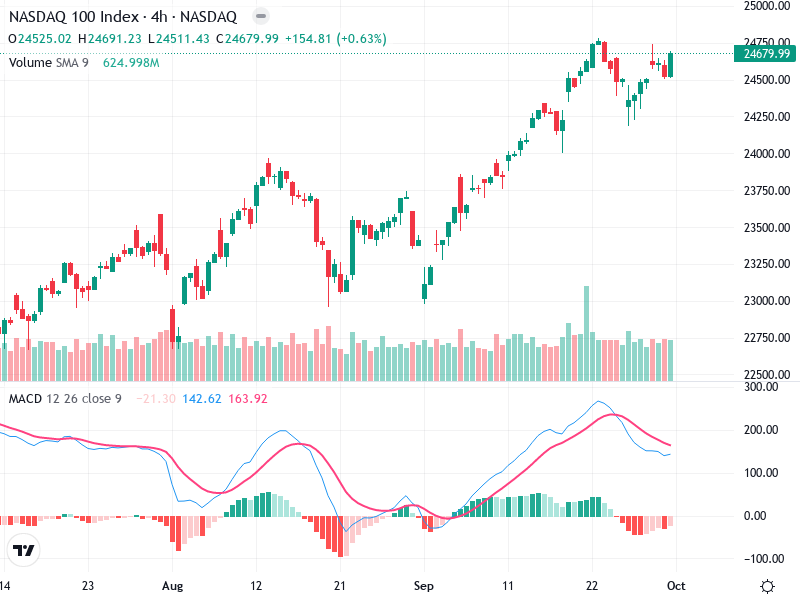
The chart shows a strong bullish trend from mid-August to late September, characterized by a series of higher highs and higher lows.

Recently, there is a formation resembling a potential correction or consolidation phase, with smaller candlesticks indicating indecision.

The price is nearing previous highs around 24,750, which could act as a resistance level. A breakout above this could signal further bullish momentum.

MACD Analysis

The MACD line is above the Signal line, indicating a recent bullish crossover.

The lines are converging, suggesting potential weakening momentum.

No significant divergence observed between MACD and price action at this time.

Volume Analysis

Volume has been relatively stable with occasional spikes.

A recent volume spike accompanied the move upwards around mid-September, supporting the bullish price action.

The previous volume spikes could indicate institutional involvement during major price movements.

Support & Resistance

The level around 24,750 is critical as it has been tested multiple times.

There is support at around 24,000, evident from prior price bounces.

Monitoring these levels is crucial for determining potential price movements.

Actionable Insights

Consider buying if the price breaks and holds above the 24,750 resistance, especially if supported by increased volume.

If the MACD shows a bearish crossover and the price fails to breach resistance, a retracement towards lower support levels is possible.

Current holders may continue holding as long as the bullish structure remains intact above key support levels.

The AI Technical Analysis Center is an informational tool only and does not constitute investment or trading advice.
This site is registered on wpml.org as a development site. Switch to a production site key to remove this banner.