Generic selectors
Exact matches only
Search in title
Search in content
Post Type Selectors

Popular stocks

Crypto

CFD

Currencies

Support

Gold

NSDQ – Technical Analysis – 4h

October 2, 2025 07:01

Quick Summary

The NASDAQ 100 Index shows strong upward momentum on its 4-hour chart.

Recent bullish patterns and increasing trading volumes suggest a positive outlook.

Key support and resistance levels will be pivotal in determining future price movements.

Candlestick Analysis

A few bullish patterns can be observed in the recent action, notably a bullish engulfing pattern around mid-September, which was followed by a significant upward movement.

There are recent green candles indicating a continuation of bullish sentiment.

The overall trend is bullish, with higher highs and higher lows evident from mid-August onwards.

MACD Analysis

The MACD line is above the Signal line after a recent bullish crossover, which suggests ongoing upward momentum.

The histogram shows increasing positive momentum, confirming the bullish sentiment.

No significant divergences observed between price action and MACD, supporting the current trend's strength.

Volume Analysis

Volume spikes were noticeable during recent bullish movements, suggesting strong buying interest.

Increased volume on upward price movements strengthens the bullish outlook and indicates potential institutional buying.

A notable volume increase occurred around early-September, coinciding with price rises.

Support & Resistance

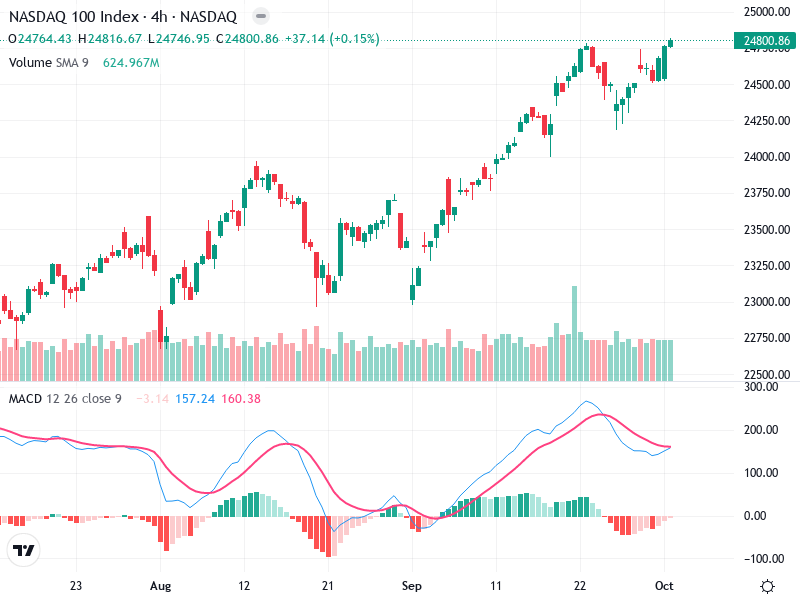
Support around 24,500 and 24,300, tested multiple times in the past.

Resistance near 24,800, where the price currently trades. A breakout above this could lead to further highs.

These levels will be crucial for potential reversals or breakout validation. Monitoring price action around these levels will provide insight into future movements.

Actionable Insights

Consider a buy on a clear breakout above 24,800 with strong volume confirmation.

Watch for signs of reversal at resistance levels or a bearish crossover in MACD to consider selling.

Current bullish trend suggests holding positions until a clear reversal signal is observed.

The AI Technical Analysis Center is an informational tool only and does not constitute investment or trading advice.
This site is registered on wpml.org as a development site. Switch to a production site key to remove this banner.