Generic selectors
Exact matches only
Search in title
Search in content
Post Type Selectors

Popular stocks

Crypto

CFD

Currencies

Support

Gold

AUD/USD – Technical Analysis – 4h

October 2, 2025 12:03

Quick Summary

The Australian Dollar / U.S. Dollar chart exhibits intriguing movements over the 4-hour timeframe. A trend reversal is observed, with a bullish engulfing pattern marking potential shifts.

The asset has shown sideways movements after a brief recovery, hinting at possible market indecision.

Candlestick Analysis

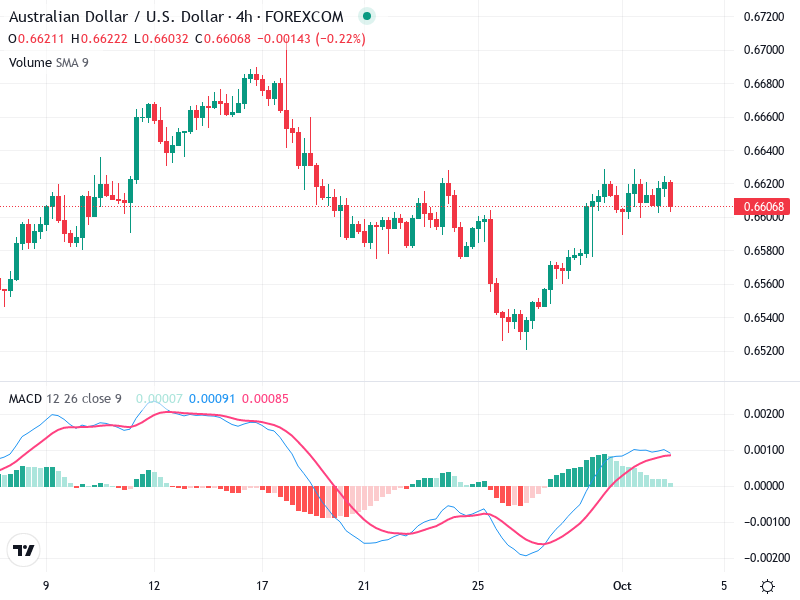
The chart initially shows a bearish trend, followed by a recovery and a sideways movement towards the end.

Around the end of September, there is a bullish engulfing pattern indicating a potential reversal from the preceding downtrend.

Several doji-like formations indicate indecision in the market around the 0.662 level.

MACD Analysis

A recent bullish crossover where the MACD line crosses above the signal line suggests a possible upward momentum.

The histogram shows decreasing momentum as it moves closer to the zero line, indicating weakening bullish momentum.

There is no significant divergence between the MACD and price action at the moment.

Volume Analysis

Volume appears to have slightly spiked during the formation of the bullish engulfing pattern, supporting the initial upward movement.

No unusual volume spikes suggesting significant institutional activity are present.

The volume trend does not indicate any substantial long-term commitments currently.

Support & Resistance

Key support is around the 0.654 level where the price previously rebounded.

The resistance level of 0.662 is significant, as it marks the upper boundary of the recent trading range.

Additional attention should be paid to the possible establishment of new support levels.

Actionable Insights

Consider buying if the price breaks convincingly above the 0.662 resistance with supporting volume and a sustained bullish MACD crossover.

Consider selling if the price reverses with bearish candlestick patterns from the current resistance level.

Holding might be advisable until a clear breakout or breakdown is established.

The AI Technical Analysis Center is an informational tool only and does not constitute investment or trading advice.
This site is registered on wpml.org as a development site. Switch to a production site key to remove this banner.