Generic selectors
Exact matches only
Search in title
Search in content
Post Type Selectors

Popular stocks

Crypto

CFD

Currencies

Support

Gold

NSDQ – Technical Analysis – 4h

October 3, 2025 07:00

Quick Summary

The asset chart shows a strong bullish trend with upward momentum. Key levels of support and resistance are highlighted, providing critical points for traders to watch. Volume analysis further supports the ongoing price rise.

Candlestick Analysis

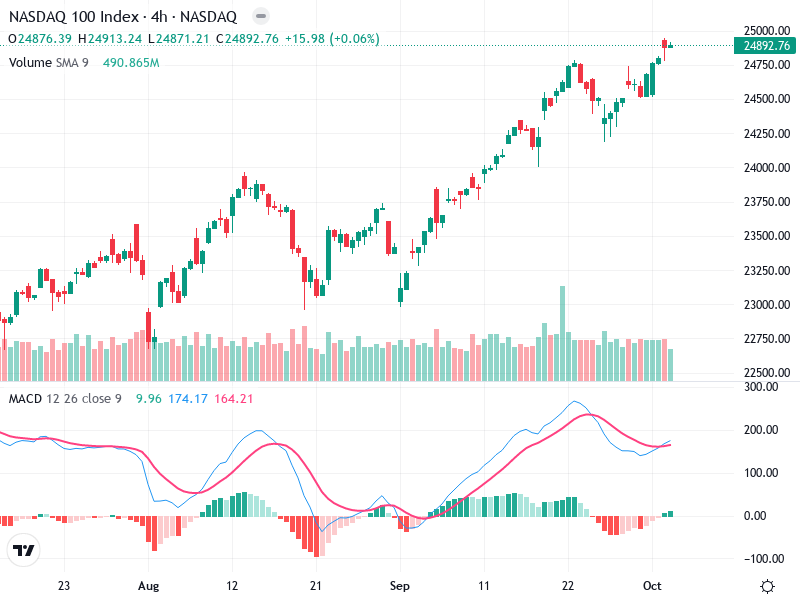
The chart displays several bullish candlesticks, indicating strong upward momentum. Notably, there are bullish engulfing patterns visible, which suggest continuation of the current trend.

The overall trend is bullish, with the price making higher highs and higher lows. The upward move appears strong and sustained.

A breakout is observed above the 24,750 level, indicating a potential new support level for continuation of the bullish trend.

MACD Analysis

Currently, the MACD line is above the Signal line, indicating a bullish crossover that suggests positive momentum is continuing.

The histogram is in positive territory and widening, reinforcing the bullish momentum and suggesting that the upward trend may continue.

There are no significant divergences between the MACD and price action, which supports the current bullish trend.

Volume Analysis

There’s an increase in volume during the recent uptrend, which supports the price rise. Volume often validates price action; thus, this rise in volume corroborates the bullish momentum.

A noticeable spike in volume occurred at the breakout point around the 24,750 level, indicating potential institutional activity and increased trader interest.

Sustained high volume with price rise would confirm further strength in the bullish trend.

Support & Resistance

The recent breakout suggests a new support level at the 24,750 mark, which could be tested if the price pulls back.

The next potential resistance could be near 25,000, which is a psychological level and could pose a challenge for further upward movement.

Traders should be cautious near the resistance level and monitor for reversal signs.

Actionable Insights

Consider buying on a pullback to the 24,750 support level if the bullish trend continues.

Be cautious at the 25,000 resistance and watch for any reversal signals.

Observe for any reversal patterns near resistance. Also, monitor volume; sustained high volume with price rise would confirm strength.

The AI Technical Analysis Center is an informational tool only and does not constitute investment or trading advice.
This site is registered on wpml.org as a development site. Switch to a production site key to remove this banner.