Generic selectors
Exact matches only
Search in title
Search in content
Post Type Selectors

Popular stocks

Crypto

CFD

Currencies

Support

Gold

NSDQ – Technical Analysis – 4h

October 6, 2025 07:00

Quick Summary

The NASDAQ 100 Index has shown a bullish trend recently, with indicators suggesting a possible continuation of this trend. However, there is some caution advised due to mixed signals in price action and momentum indicators.

Investors should monitor key resistance and support levels for guidance.

Candlestick Analysis

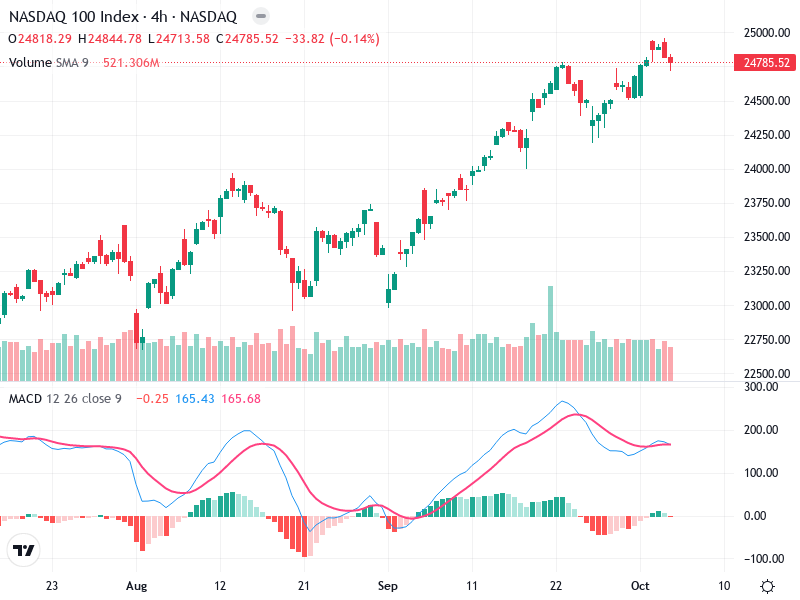
The overall trend is bullish with a series of higher highs and higher lows observed since mid-August.

Recently, there's a bearish candlestick at the latest high, indicating potential selling pressure or hesitation at current levels.

The index appears to be in a consolidation phase after the recent highs, watch for either a continuation above the recent resistance or a pullback to support levels.

MACD Analysis

The MACD Line is close to the Signal Line, indicating a potential bearish crossover.

The histogram is declining, further supporting the potential for weakening momentum.

No significant divergence is observed at this time.

Volume Analysis

Volume has been relatively stable, with no significant spikes recently.

The latest bearish candlestick was accompanied by lower volume compared to previous bars, which may indicate a lack of strong conviction behind the selling.

No unusual spikes suggesting major institutional activity currently, though previous uptrend volume supported price increases.

Support & Resistance

Resistance is approximately around the 24850 level, marked by recent highs.

Key support is near the 24500 level, where previous consolidation occurred.

Traders should monitor these levels for potential breakouts or reversals.

Actionable Insights

Consider buying if there's a confirmed breakout above the recent resistance with increased volume, indicating strong bullish sentiment.

If a bearish crossover on the MACD confirms, a short position might be considered, especially if price falls below key support levels.

Current holders should monitor the 24500 support and MACD developments for risk management.

The AI Technical Analysis Center is an informational tool only and does not constitute investment or trading advice.
This site is registered on wpml.org as a development site. Switch to a production site key to remove this banner.