Generic selectors
Exact matches only
Search in title
Search in content
Post Type Selectors

Popular stocks

Crypto

CFD

Currencies

Support

Gold

EUR/USD – Technical Analysis – 4h

October 6, 2025 07:02

Quick Summary

The EUR/USD chart shows indecisiveness in the market with no clear bullish or bearish dominance. The presence of small-bodied candles and stable trading volume suggest a cautious trading environment.

Short-term analysis indicates a slight bearish trend, but key technical levels could shift sentiment.

Candlestick Analysis

There is no clear formation of major patterns such as bullish engulfing or doji. However, there are several small-bodied candles indicating indecision in the market.

The trend appears to be sideways to slightly bearish in the short term. Recent price action shows choppy movement with a tendency towards lower highs.

The recent price has approached a minor support level around 1.1690. A clear break below this level could indicate further downside potential.

MACD Analysis

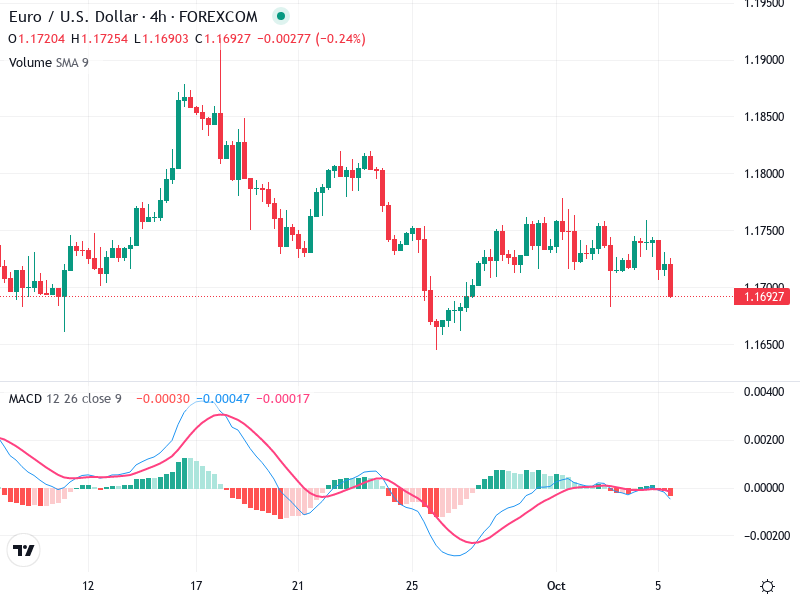
The MACD line is below the Signal line, suggesting bearish momentum. The lines are currently converging, indicating potential indecisiveness or a potential shift.

The histogram is slightly negative and shows diminishing momentum, consistent with a sideways or weakening bearish trend.

There are no immediate divergences visible between the MACD and price action. Both are somewhat aligned in indicating bearish pressure.

Volume Analysis

Volume appears relatively stable with no significant spikes. The absence of volume spikes suggests a lack of strong conviction behind recent price moves.

The stable volume does not strongly support either a bearish or bullish continuation, aligning with the current sideways price action.

This stable volume aligns with the sideways price action currently observed.

Support & Resistance

Immediate support is observed around the 1.1690 level. A breakdown could lead to further selling pressure.

Resistance is seen near 1.1750. A move above this could potentially reverse the recent bearish sentiment.

Watch these levels closely for potential breakout or pullback scenarios.

Actionable Insights

Considering current bearish indicators with no strong bullish reversal signs, cautious traders might hold or consider selling on a breakdown below support.

Watch for a confirmed close below 1.1690 for a short position.

A bullish reversal candle or MACD crossover might indicate a buying opportunity.

The AI Technical Analysis Center is an informational tool only and does not constitute investment or trading advice.
This site is registered on wpml.org as a development site. Switch to a production site key to remove this banner.