Generic selectors
Exact matches only
Search in title
Search in content
Post Type Selectors

Popular stocks

Crypto

CFD

Currencies

Support

Gold

NSDQ – Technical Analysis – 4h

October 7, 2025 07:00

Quick Summary

The chart indicates a positive trend in the asset’s price movements.

Technical indicators suggest a continuation of the upward trend.

Investors should closely watch for key trend signals.

Candlestick Analysis

The overall trend is bullish as the price has been making higher highs and higher lows.

Recently, there's a formation of a bullish engulfing pattern, suggesting potential continuation of the upward trend.

The price broke out above the previous resistance around 24,750, which is now acting as support.

MACD Analysis

The MACD line is above the Signal line, indicating bullish momentum. There is a recent bullish crossover which supports the continuation of the uptrend.

The MACD histogram is in positive territory and expanding, suggesting increasing bullish momentum.

There is no significant divergence noted between MACD and price action.

Volume Analysis

There is a consistent volume level with a slight increase during the recent uptrend, supporting the bullish price movement.

No unusual spikes in volume, indicating steady buying interest rather than sudden institutional activity.

Steady volume trends align with current price action.

Support & Resistance

Key support is at the previously broken resistance level of 24,750. If the price holds above this, it could indicate strong buyer interest.

Immediate resistance is now around 25,250. A breakout above this level could result in further upward movement.

Monitoring support and resistance levels is crucial for potential entry and exit points.

Actionable Insights

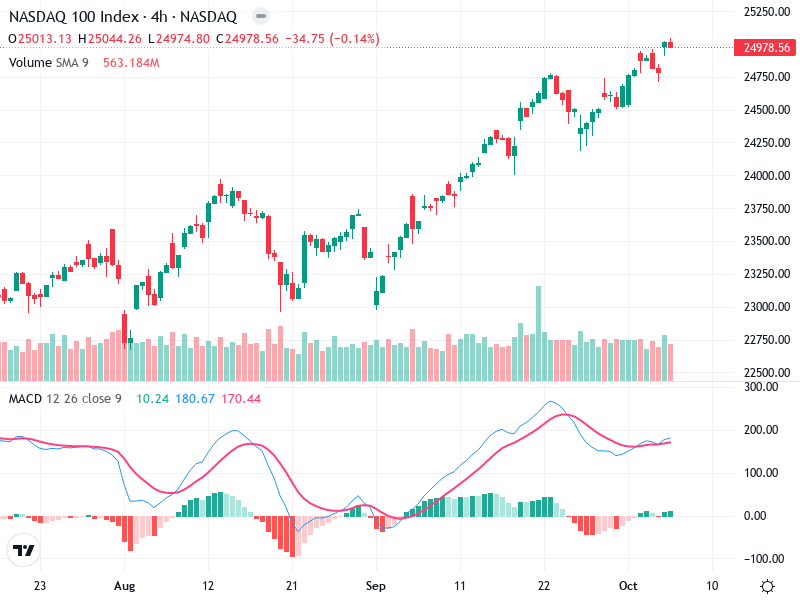
Consider buying on pullbacks to 24,750 if supported by volume, looking for a continuation of the uptrend.

Look for bearish signals, such as a bearish candlestick pattern or a MACD crossover, before considering selling.

Monitor the MACD histogram for any signs of weakening momentum and watch for volume changes.

The AI Technical Analysis Center is an informational tool only and does not constitute investment or trading advice.
This site is registered on wpml.org as a development site. Switch to a production site key to remove this banner.