Generic selectors
Exact matches only
Search in title
Search in content
Post Type Selectors

Popular stocks

Crypto

CFD

Currencies

Support

Gold

NZD/USD – Technical Analysis – 4h

October 7, 2025 12:00

Quick Summary

The asset’s chart shows a recent sideways trend following a significant downtrend. There’s no clear breakout or pullback zone at the moment.

No strong candlestick patterns are visible, indicating market indecision.

Candlestick Analysis

The chart shows a recent sideways trend following a significant downtrend. There's no clear breakout or pullback zone currently.

No strong candlestick patterns indicating reversal or continuation are visible at the moment.

The recent candles suggest indecision, with possible small doji-like formations reflecting market uncertainty.

MACD Analysis

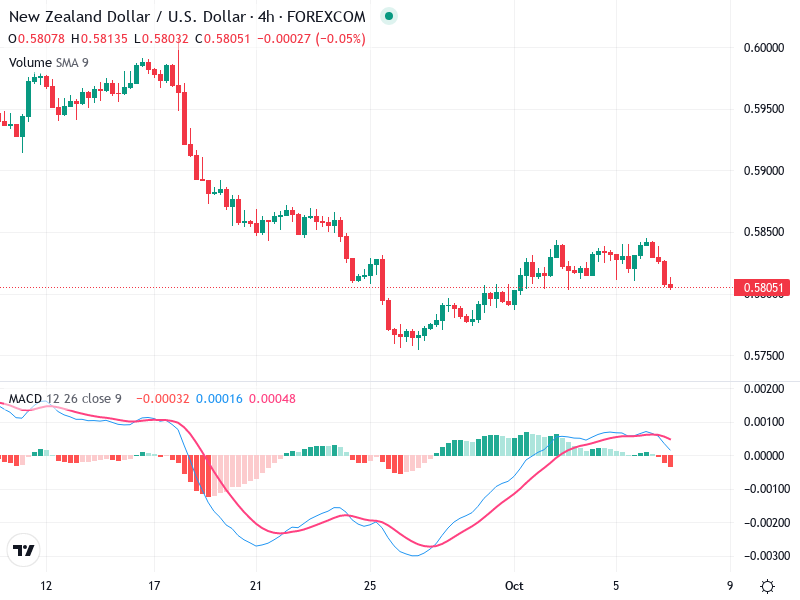
The MACD line is crossing below the Signal line, indicating a bearish crossover that could suggest further downside momentum.

The MACD histogram is transitioning from positive to negative, reinforcing the loss of bullish momentum.

No significant divergences between the MACD and price action are currently observed.

Volume Analysis

Volume appears relatively stable, with no extraordinary spikes that might suggest institutional activity.

The current sideways movement lacks significant volume, suggesting the price movement isn't strongly supported by trading activity.

Market sentiment appears muted due to the stable volume levels.

Support & Resistance

There is a key support level near the current price around 0.5800. A break below this could indicate further downside.

Recent highs near 0.5850 act as the nearest resistance level.

A move above this resistance might suggest a possible reversal.

Actionable Insights

Consider a cautious approach with a potential sell strategy if the support at 0.5800 is breached with confirmation.

Alternatively, look for buying opportunities if prices break and sustain above 0.5850 with increased volume.

Watch for confirmation of bearish momentum from further MACD divergence or a strong candle pattern.

The AI Technical Analysis Center is an informational tool only and does not constitute investment or trading advice.
This site is registered on wpml.org as a development site. Switch to a production site key to remove this banner.