Generic selectors
Exact matches only
Search in title
Search in content
Post Type Selectors

Popular stocks

Crypto

CFD

Currencies

Support

Gold

AUD/USD – Technical Analysis – 4h

October 7, 2025 12:02

Quick Summary

The asset chart indicates a consolidation occurring after a significant downtrend, suggesting potential accumulation.

A notable support and resistance range has formed, providing clear regions for potential price action changes.

Candlestick Analysis

The chart does not showcase any particularly strong candlestick patterns like bullish engulfing or doji at the current position. However, a recent consolidation phase near the support level is forming a base.

The pair is in a sideways trend after a significant downtrend, indicating possible accumulation.

The region around 0.6620 serves as a minor resistance, while 0.6560 appears to be a support zone where price has bounced before.

MACD Analysis

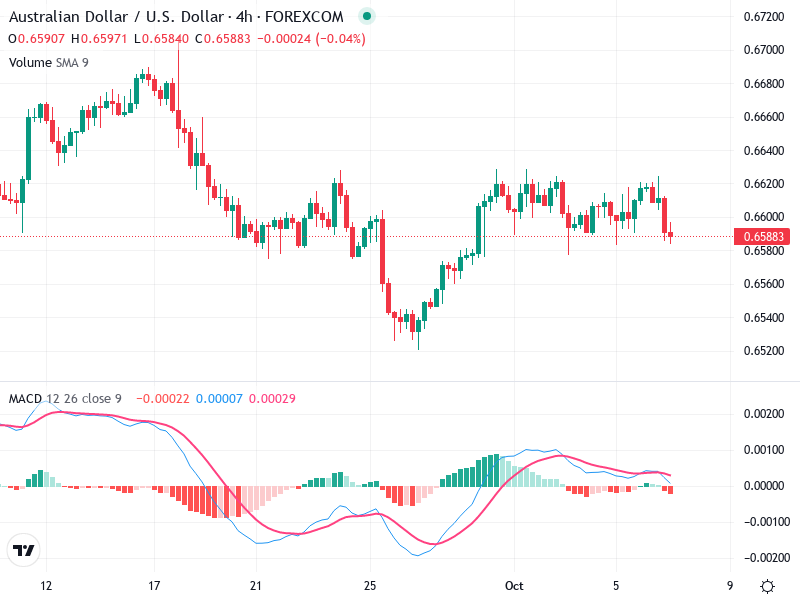
The MACD line is just below the Signal line, indicating a short-term bearish phase, but the difference between the two is minimal, suggesting a potential shift in trend.

The histogram shows declining momentum, suggesting that the recent bullish attempt could be pausing.

There are no clear divergences between MACD and price action at this time, indicating alignment.

Volume Analysis

Volume seems relatively stable with no significant spikes, indicating a lack of strong conviction in either direction.

The stable volume during the sideways price action supports consolidation before the next significant move.

No unusual volume spikes are observed, suggesting no significant institutional activity.

Support & Resistance

Support Levels: Around 0.6560, providing a base for potential reversals if tested again.

Resistance Levels: At approximately 0.6620, acting as a ceiling for recent price actions.

This consolidation may precede a trend continuation or reversal; hence, watching the support/resistance levels closely is crucial.

Actionable Insights

Potential Strategy:

Buy Strategy: Consider buying if the price convincingly breaks above 0.6620 with increased volume, indicating a potential bullish move.

Sell Strategy: A failure to hold 0.6580 could see a retest of the 0.6560 support level. A break below that with volume might signal more downside.

The AI Technical Analysis Center is an informational tool only and does not constitute investment or trading advice.
This site is registered on wpml.org as a development site. Switch to a production site key to remove this banner.