Generic selectors
Exact matches only
Search in title
Search in content
Post Type Selectors

Popular stocks

Crypto

CFD

Currencies

Support

Gold

NSDQ – Technical Analysis – 4h

October 8, 2025 07:00

Quick Summary

The chart illustrates the asset’s current trajectory, which is predominantly bullish. Observations suggest room for further upward movement, provided key resistance levels are breached.

The asset is approaching a critical resistance zone, potentially challenging its recent highs.

Candlestick Analysis

The current trend is bullish, with a series of higher highs and higher lows evident on the chart.

Recently, there is a small retracement after reaching near 25,000. No strong reversal patterns like bearish engulfing or hammers are in view, suggesting a continuation of the uptrend is more probable.

The area near 25,000 appears to be a significant resistance level. A clear breakout above this could lead to further gains.

MACD Analysis

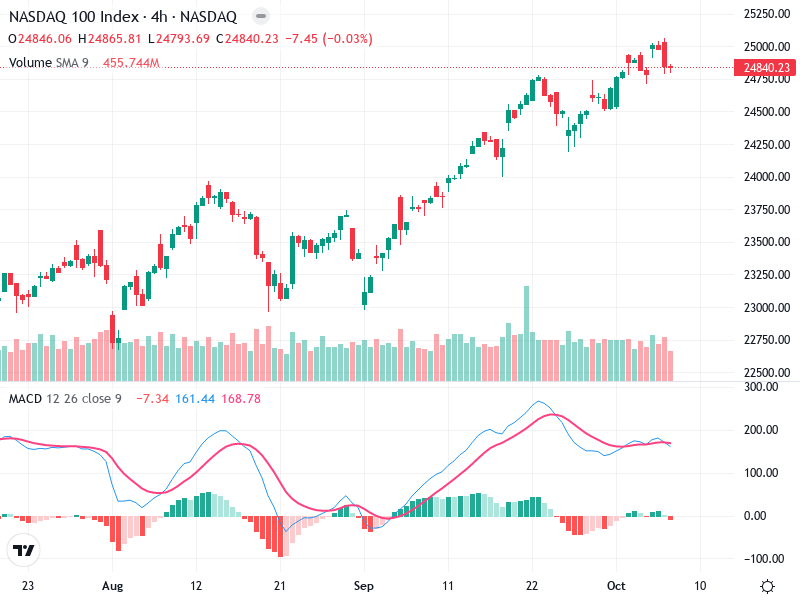
The MACD line is slightly above the signal line, indicating recent bullish sentiment. Currently, the lines are converging, which might suggest weakening momentum.

Recent histogram bars are diminishing, indicative of slowing momentum, which warrants attention for potential changes in trend strength.

No notable divergence between MACD and price; both are trending upwards, maintaining the bullish sentiment.

Volume Analysis

Volume shows a spike during upward movements, which supports the bullish trend. However, the recent decline in volume might suggest cautious trading as the index approaches resistance.

There is no extremely unusual volume activity present, suggesting the current price movement is driven by general market dynamics rather than extraordinary institutional trades.

Current volume trends align with the asset approaching resistance, necessitating careful monitoring.

Support & Resistance

Around 25,000 is a critical resistance area. A breakout above this level with strong volume could confirm further upside potential.

The 24,500 level appears to be acting as short-term support, where previous resistance has possibly turned into support.

Attention should be given to these critical levels as the asset nears decisive points in its upward trajectory.

Actionable Insights

Consider buying on a breakout above 25,000 with a volume increase for confirmation.

Be cautious if the price retreats and closes below 24,500, as it may signal a deeper pullback.

Current holders might watch for consolidation or breakout signals before making decisions.

The AI Technical Analysis Center is an informational tool only and does not constitute investment or trading advice.
This site is registered on wpml.org as a development site. Switch to a production site key to remove this banner.