Generic selectors
Exact matches only
Search in title
Search in content
Post Type Selectors

Popular stocks

Crypto

CFD

Currencies

Support

Gold

NSDQ – Technical Analysis – 4h

October 9, 2025 07:00

Quick Summary

The NASDAQ 100 index is currently exhibiting a strong upward trend. With a series of higher highs and higher lows, it shows potential for further growth. Investors should pay attention to resistance levels around 25,150 and support near 24,500, which are crucial for determining future price movements.

Candlestick Analysis

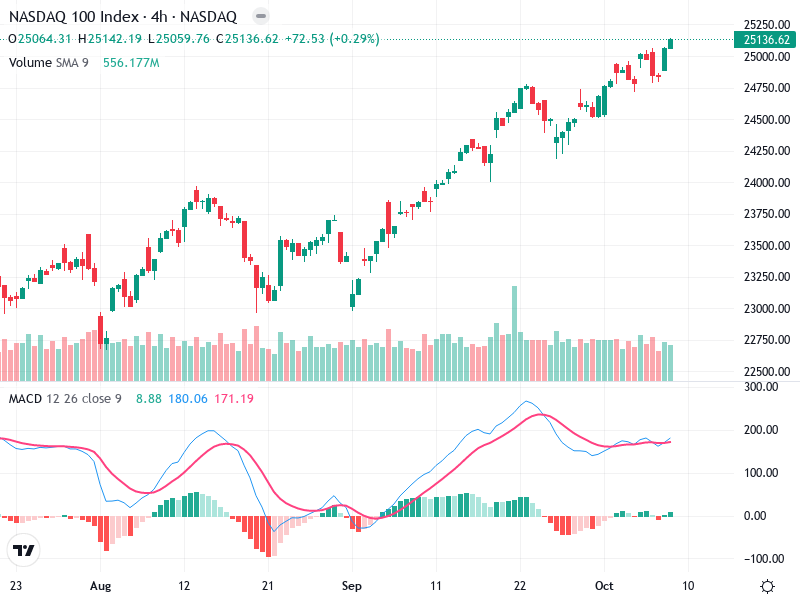
The NASDAQ 100 index is exhibiting a clear bullish trend, shown by the consecutive series of higher highs and higher lows.

Recently, there is a three-candle pattern with small bodies which may suggest a pause in movement, indicative of a potential continuation rather than reversal.

The current price level near 25,136.62 is testing previous highs, suggesting a potential breakout if momentum continues.

MACD Analysis

The MACD line is above the Signal line, indicating a bullish crossover. This supports the ongoing upward trend.

The positive and growing histogram bars suggest increasing bullish momentum.

There is no significant divergence between the MACD and price action, reinforcing the validity of the current uptrend.

Volume Analysis

Volume has been decreasing slightly during the recent upward movement, which may imply a weakening momentum or cautious optimism among traders.

No unusual spikes in volume, reducing the likelihood of sudden institutional moves.

While the volume doesn’t heavily support the sharp price increases, it hasn’t shown significant distribution either.

Support & Resistance

The area around 25,150 acts as a resistance zone, coinciding with the top levels of the current price action.

The previous support is seen near 24,500, a crucial level to hold if the price pulls back.

These levels are essential for understanding potential reversals or continuation patterns.

Actionable Insights

Consider buying if the price breaks and closes above the resistance level with substantial volume.

Consider taking profits if there is a rejection at resistance, especially if followed by a bearish pattern.

For those already long, holding can be considered given the continued bullish signals unless there’s a daily candle closing below 24,500.

The AI Technical Analysis Center is an informational tool only and does not constitute investment or trading advice.
This site is registered on wpml.org as a development site. Switch to a production site key to remove this banner.