Generic selectors
Exact matches only
Search in title
Search in content
Post Type Selectors

Popular stocks

Crypto

CFD

Currencies

Support

Gold

AUD/USD – Technical Analysis – 4h

October 9, 2025 12:03

Quick Summary

This analysis provides insights into the ‘s stock chart. The focus is on various technical indicators that may influence its future price movements. Careful observation of these indicators could present potential trading opportunities.

Candlestick Analysis

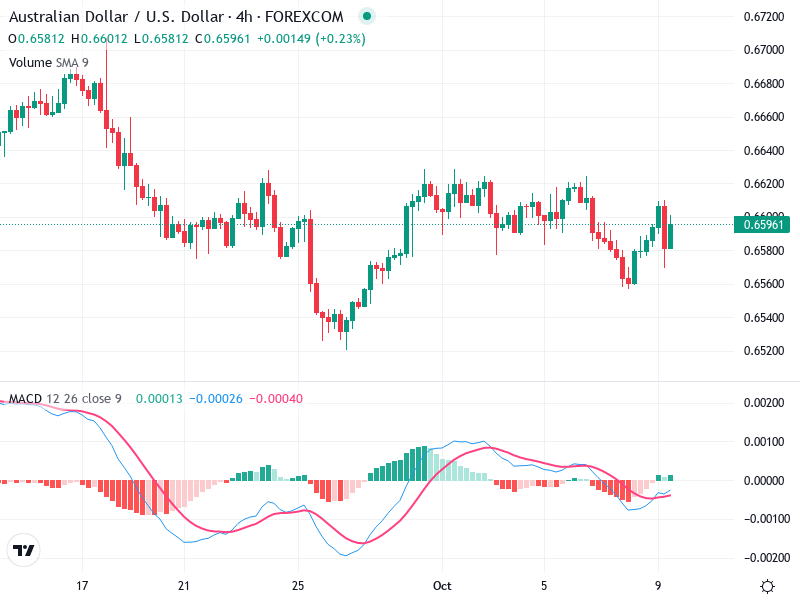
There are several potential reversal candlestick patterns visible, including potential dojis and small-bodied candles, indicating market indecision.

No clear bullish engulfing or hammer patterns are observed recently, suggesting lack of a strong immediate reversal signal.

The trend appears to be sideways in the short-term. There have been some minor bullish and bearish swings, but no significant breakout in either direction.

MACD Analysis

The MACD line is slightly below the Signal line but they are converging, suggesting a potential bullish crossover in the near future.

The histogram is above the zero line, indicating mild bullish momentum but the small bars suggest weakening strength.

There is no clear divergence between MACD and price action at this time.

Volume Analysis

Volume appears to be relatively consistent, with no major spikes observed in the recent sessions.

Current volume levels do not strongly support any significant price change, correlating well with the noted sideways trend.

No significant volume spikes suggesting institutional activity are noticeable.

Support & Resistance

Support is around 0.6550.

Resistance is around 0.6620.

These levels have been tested multiple times, providing potential zones for reversal or significant price action.

Actionable Insights

If currently invested, monitor the developments closely around the MACD indicator for a confirmed bullish crossover.

A breakout above 0.6620 with increased volume could provide a buying opportunity.

Watch for confirmation of bullish or bearish signals through MACD crossover and volume changes.

The AI Technical Analysis Center is an informational tool only and does not constitute investment or trading advice.
This site is registered on wpml.org as a development site. Switch to a production site key to remove this banner.