Generic selectors
Exact matches only
Search in title
Search in content
Post Type Selectors

Popular stocks

Crypto

CFD

Currencies

Support

Gold

NSDQ – Technical Analysis – 4h

October 10, 2025 07:01

Quick Summary

The analysis focuses on where the current chart setup reveals critical insights. Despite the bullish trend, certain indicators suggest caution.

Key resistance and support levels could guide future price action, with the MACD and volume playing pivotal roles in confirming trends.

Candlestick Analysis

The chart shows a strong bullish trend with higher highs and higher lows, indicating upward momentum.

Notice the recent small-bodied candlesticks near the top, suggesting a potential exhaustion of the current upward trend.

The recent highs near 25100 might act as a resistance level, while the previous consolidation area around 24500 could serve as support.

MACD Analysis

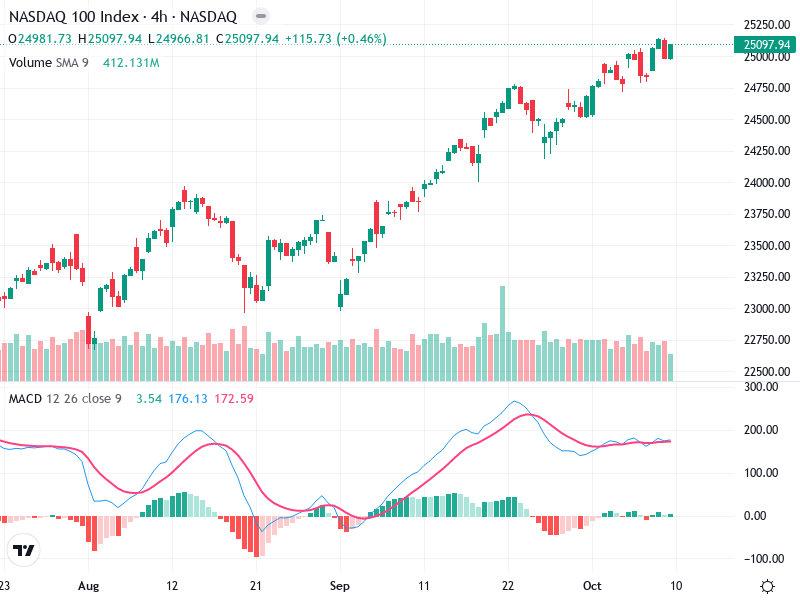
The MACD line is above the Signal line, confirming the bullish momentum. However, the lines are converging, indicating possible weakening of the upward move.

The MACD histogram is near the zero line, suggesting that momentum is slowing down.

No significant divergence is visible between the MACD and price action, supporting the continuation of the trend for now.

Volume Analysis

Volume appears to be steady with some spikes, coinciding with price pushes upwards.

The volume supports the bullish trend, but there has been no large volume increase to suggest strong institutional buying.

The noticeable spike in early September aligns with a strong price movement, indicating strong buying interest at that point.

Support & Resistance

The recent peak near 25100 is a key resistance level. A breakout above this could signal further upside.

Support is seen around 24500, where previous consolidation and a bounce occurred.

Actionable Insights

Consider buying if there is a breakout above the 25100 level with high volume.

If price struggles to break past the resistance and reverses, it might be prudent to sell.

Maintain positions while keeping an eye on volume and MACD for signs of continuation or reversal.

The AI Technical Analysis Center is an informational tool only and does not constitute investment or trading advice.
This site is registered on wpml.org as a development site. Switch to a production site key to remove this banner.