Generic selectors
Exact matches only
Search in title
Search in content
Post Type Selectors

Popular stocks

Crypto

CFD

Currencies

Support

Gold

EUR/USD – Technical Analysis – 4h

October 10, 2025 07:03

Quick Summary

The EUR/USD chart shows a clear bearish trend with lower highs and lower lows. The recent candlestick patterns indicate possible stabilization signs, suggesting indecision among traders. Key support and resistance levels could play a crucial role in determining the next movement for this asset.

Candlestick Analysis

The most recent candlesticks show signs of stabilization after a strong bearish trend, with smaller bodies indicating indecision.

No significant reversal patterns like bullish engulfing or hammer are present currently.

The chart displays a clear bearish trend, with lower highs and lower lows extending over the past sessions.

MACD Analysis

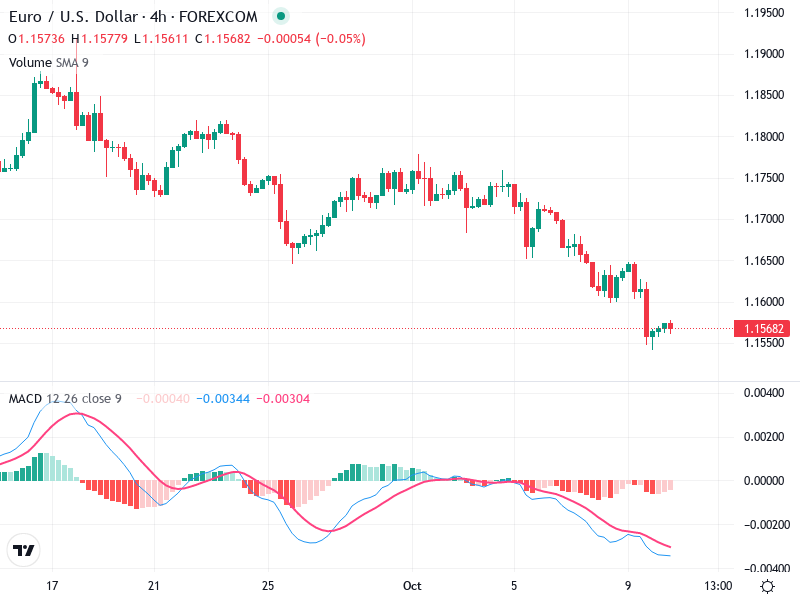
The MACD line is below the Signal line, indicating bearish momentum.

There might be a potential for a crossover if the price stabilizes, which should be monitored.

The MACD histogram shows negative values, reflecting current bearish momentum, although the bars are decreasing, suggesting weakening momentum.

Volume Analysis

There are no significant recent spikes, suggesting lack of strong buying interest or institutional activity.

Recent price declines are accompanied by lower volume, which may indicate the selling pressure is lessening.

The absence of significant volume changes suggests a cautious approach is needed.

Support & Resistance

Support: Around 1.1550 appears to be a key support level, where recent price action has found some stability.

Resistance: Near 1.1650, where price has previously shown resistance.

These levels are crucial in assessing future price movements.

Actionable Insights

Consider selling if the price breaks below 1.1550 with increased volume, signaling continuation of bearish trend.

Wait for confirmation of stabilizing or reversing trend before new buy positions.

Watch for potential bullish MACD crossover as an early signal for reversal.

The AI Technical Analysis Center is an informational tool only and does not constitute investment or trading advice.
This site is registered on wpml.org as a development site. Switch to a production site key to remove this banner.