Generic selectors
Exact matches only
Search in title
Search in content
Post Type Selectors

Popular stocks

Crypto

CFD

Currencies

Support

Gold

NZD/USD – Technical Analysis – 4h

October 10, 2025 12:00

Quick Summary

The technical analysis of indicates a prevailing downward momentum.

This analysis incorporates insights from candlestick patterns, MACD signals, and volume trends to provide a comprehensive overview.

Analyzing support and resistance levels gives traders actionable insights into potential market movements.

Candlestick Analysis

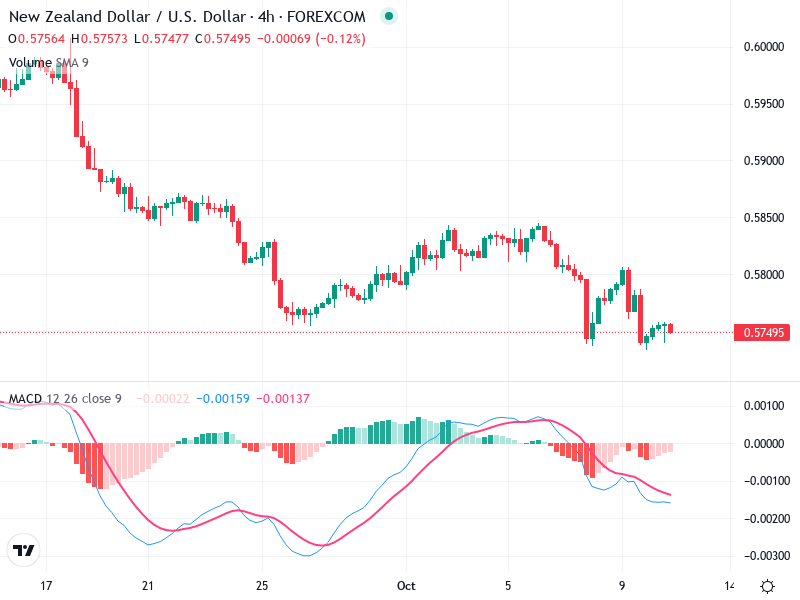
The chart shows a predominantly bearish trend with intermittent periods of consolidation.

There are no major bullish reversal patterns apparent, but there are several bearish candlesticks, indicating selling pressure.

Around the 0.58000 mark, the price experienced a minor consolidation before continuing downwards, indicating a failed attempt to break higher.

MACD Analysis

The MACD line is below the Signal line, showing a bearish crossover that suggests downward momentum.

The MACD histogram is negative and seems to be widening, indicating strengthening bearish momentum.

No clear divergence is noticed between the MACD and the price action, supporting the current bearish trend.

Volume Analysis

The volume is relatively stable with no significant spikes to suggest institutional interest.

The stable volume during price drops confirms selling pressure without any significant buying interest stepping in to alter the decline.

Overall, the volume trends reinforce the bearish sentiment indicated by other indicators.

Support & Resistance

The region around 0.57000 appears to be a temporary support level, which has seen some buying interest.

The 0.58000 level acts as a significant resistance, where prior attempts to rally have been halted.

These levels provide key markers for potential price reversals or continuations.

Actionable Insights

Current indications suggest considering short positions while maintaining caution near the 0.57000 support level. Any breach below this could signal further declines.

Watch for any reversal patterns or bullish crossovers in the MACD, which may indicate a potential change in sentiment.

The price action near support levels will be crucial.

The AI Technical Analysis Center is an informational tool only and does not constitute investment or trading advice.
This site is registered on wpml.org as a development site. Switch to a production site key to remove this banner.