Generic selectors
Exact matches only
Search in title
Search in content
Post Type Selectors

Popular stocks

Crypto

CFD

Currencies

Support

Gold

AUD/USD – Technical Analysis – 4h

October 10, 2025 12:02

Quick Summary

The chart reveals important patterns and trends, providing insights into possible future movements. Observing candlestick formations helps identify potential reversal or continuation signals. MACD and volume analysis further reinforce the current market sentiment.

This comprehensive analysis suggests crucial support and resistance levels that traders should monitor. Strategies developed based on these insights facilitate informed decision-making in the market.

Candlestick Analysis

The analysis begins with a strong bearish trend characterized by multiple red candlesticks.

A possible hammer pattern on September 25th hinted at a reversal, but a bearish engulfing pattern suggests continued downward pressure.

The resistance around 0.6600 and support at 0.6520 are pivotal zones that have recently influenced price action.

MACD Analysis

Current MACD readings show the line below the Signal line, confirming bearish momentum.

The histogram shift from positive to negative indicates waning bullish momentum and rising bearish pressure.

No clear divergences are observed, but vigilant monitoring for any emerging divergence signals is recommended.

Volume Analysis

Volumes are generally low, with a spike during the bearish engulfing pattern, supporting the bearish outlook.

This spike may suggest institutional selling during the recent downturn, as high-volume moves often point to significant market participant actions.

Tracking volume alongside price movement remains crucial in confirming trend strength.

Support & Resistance

Key resistance is firmly placed at 0.6600, a zone where the price has struggled recently to break above.

Initial support is identified around 0.6520, with additional evaluation needed if this level is breached.

These levels offer actionable points for entry and exit based on breakout or hold strategies.

Actionable Insights

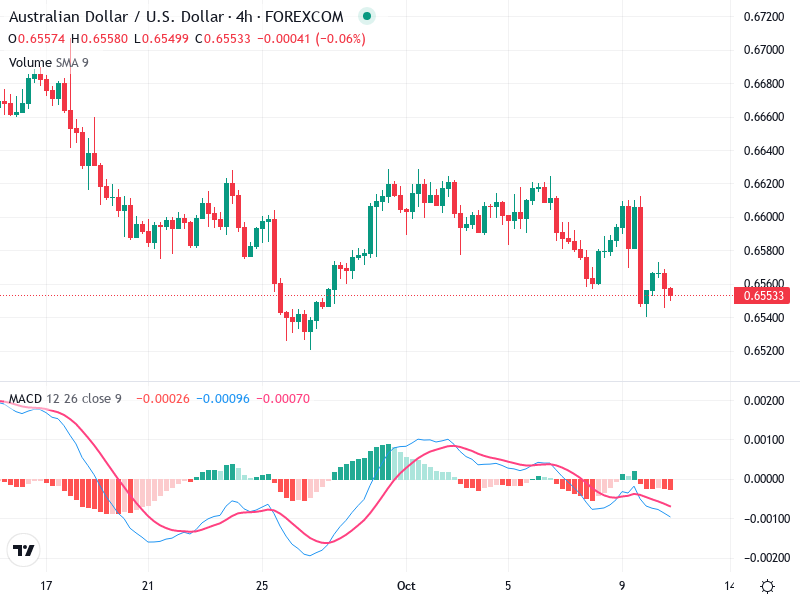
Consider a selling strategy if the price moves below 0.6520, ensuring a stop loss just above 0.6600 to manage risk.

Currently, holding is advisable while monitoring key support/resistance levels for breaches, which could signal entry opportunities.

Focus on price actions with volume confirmation for potential breakouts, enhancing trade setup reliability.

The AI Technical Analysis Center is an informational tool only and does not constitute investment or trading advice.
This site is registered on wpml.org as a development site. Switch to a production site key to remove this banner.