Generic selectors
Exact matches only
Search in title
Search in content
Post Type Selectors

Popular stocks

Crypto

CFD

Currencies

Support

Gold

NSDQ – Technical Analysis – 4h

October 13, 2025 07:00

Quick Summary

The chart of reveals remarkable patterns in recent price movements.

The asset’s current trend shows shifts in momentum influenced by key technical indicators.

Candlestick Analysis

The recent large red candlestick indicates strong bearish momentum, possibly a bearish engulfing pattern if it encompasses prior candles.

The recent decline suggests a bearish trend, breaking the previously bullish uptrend.

There appears to be a breakout to the downside around 24,500, indicating a potential bearish continuation.

MACD Analysis

The MACD line has crossed below the Signal line, indicating a bearish crossover. This is often a signal of continued downward momentum.

The histogram shows increasing negative values, suggesting strengthening bearish momentum.

No clear divergences observed currently. The MACD and price action align in their bearish sentiment.

Volume Analysis

There’s a noticeable spike in volume accompanying the recent price drop, which confirms the bearish move.

High volume on a significant price drop often suggests strong conviction in the sell-off, possibly indicating institutional selling.

The current volume spike may suggest increased institutional activity, supporting the downward move.

Support & Resistance

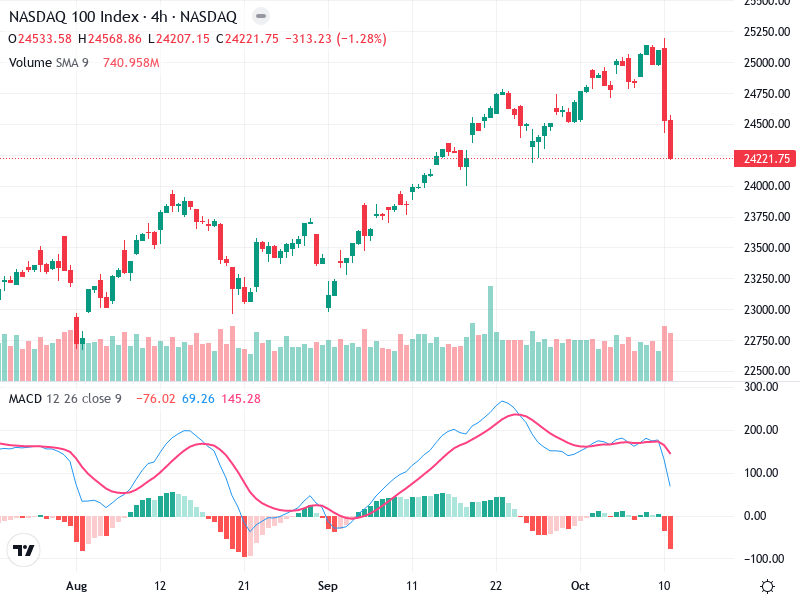
Around 24,000, a psychological and historical level that could act as support.

Previously recent highs around 25,500, now a resistance zone after the breakout.

Breaching the 24,000 support could lead to further declines, whereas holding above this level might halt the bearish trend.

Actionable Insights

Consider selling or a short position at current levels with a stop-loss just above the recent highs (25,500).

A buy might be considered upon evidence of stabilization or reversal at support (24,000).

Watch for price action around the 24,000 support level and any potential reversal patterns like a hammer or bullish engulfing near this zone.

The AI Technical Analysis Center is an informational tool only and does not constitute investment or trading advice.
This site is registered on wpml.org as a development site. Switch to a production site key to remove this banner.