Generic selectors
Exact matches only
Search in title
Search in content
Post Type Selectors

Popular stocks

Crypto

CFD

Currencies

Support

Gold

OIL – Technical Analysis – 4h

October 13, 2025 16:00

Quick Summary

The Crude Oil Futures chart indicates ongoing bearish momentum with potential stabilization visible. Traders should monitor for signs of reversal or continuation.

With important support and resistance levels identified, market participants can plan their strategies accordingly.

Candlestick Analysis

The overall trend appears bearish, especially with recent lower highs and lower lows.

There is a bearish engulfing pattern visible earlier in the downtrend, indicating continued bearish momentum.

Recently, the candles suggest indecision with smaller bodies, indicating potential for a sideways movement or reversal.

MACD Analysis

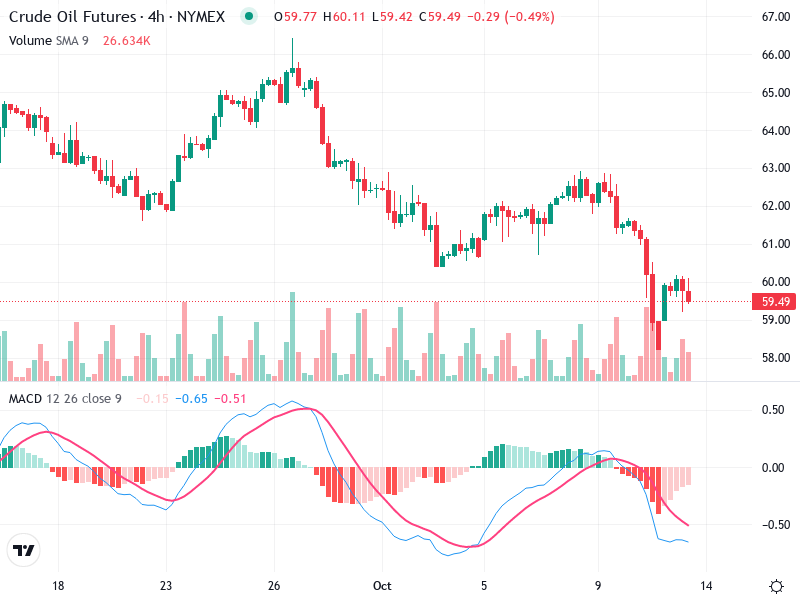
The MACD line is below the Signal line, confirming a bearish crossover, maintaining the bearish trend.

The histogram shows negative bars, reinforcing the bearish momentum, but the shortening bars suggest decreasing bearish momentum.

No clear divergence is visible between the MACD and price action, indicating alignment in the downtrend.

Volume Analysis

Volume spiked significantly during recent declines, indicating strong selling pressure, possibly institutional activity.

Current lower volume on sideways movements suggests weaker conviction or waiting for further news.

Watch for future volume spikes as they may indicate potential reversals or continuation.

Support & Resistance

Strong support is visible around the $58.50 - $59 range.

Short-term resistance is identified at around $60 - $61, which, if broken, could indicate a potential upward retracement.

Actionable Insights

Consider selling or shorting on rallies towards the $60 - $61 resistance, unless strong volume supports a breakout.

Potential buying opportunity if price convincingly breaks above $61 with strong volume or if a bullish pattern forms at support levels around $59.

Cautious traders may wait for clearer trend confirmation. Watch for confirmation through increased volume and MACD line signaling a bullish crossover for potential trend reversal signs.

The AI Technical Analysis Center is an informational tool only and does not constitute investment or trading advice.
This site is registered on wpml.org as a development site. Switch to a production site key to remove this banner.