Generic selectors
Exact matches only
Search in title
Search in content
Post Type Selectors

Popular stocks

Crypto

CFD

Currencies

Support

Gold

NSDQ – Technical Analysis – 4h

October 14, 2025 07:00

Quick Summary

The chart illustrates recent movements in with notable fluctuations.

Despite a brief pullback, there are signs of consolidation.

Key levels to watch include support at 24,000 and resistance at 25,000.

Candlestick Analysis

The chart indicates a recent bullish trend with a slight pullback followed by potential consolidation.

Notable presence of a doji after a bearish candle suggests potential indecision and a possible reversal.

Strong bullish candles following the recent drop indicate buying pressure.

MACD Analysis

The MACD line is below the Signal line, indicating a recent bearish crossover.

The histogram is showing negative momentum, but reduced selling pressure as bars shrink towards the zero line, hinting at potential reversal.

No clear divergence between MACD and price action currently.

Volume Analysis

Notable increase in volume during the recent price drop followed by a decrease as the price recovered slightly.

The increased volume on the downward movement suggests strong selling pressure, which was met with buying support as indicated by the volume decrease during recovery.

The spike during the recent drop suggests possible institutional activity.

Support & Resistance

Key support around 24,000 where buyers stepped in after the drop.

Key resistance around 25,000 which has acted as a recent barrier to upward movement.

Breaking above resistance could confirm a continuation of the bullish trend; failure to hold support may lead to further downside.

Actionable Insights

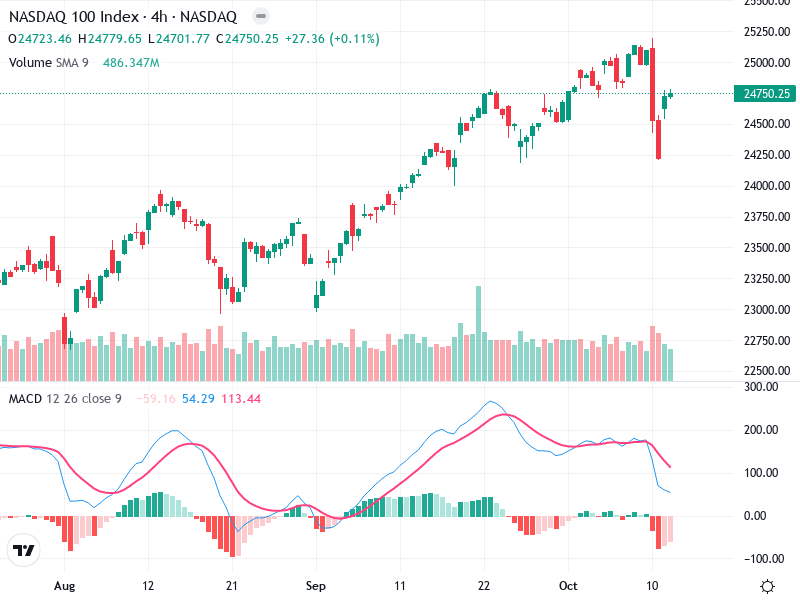
Consider buying if the price breaks above 25,000 with volume support, indicating a continuation of the bullish trend.

If price fails to maintain above 24,000, it could signal further downside.

Potential hold if price consolidates between 24,000 and 25,000, awaiting clearer signals.

The AI Technical Analysis Center is an informational tool only and does not constitute investment or trading advice.
This site is registered on wpml.org as a development site. Switch to a production site key to remove this banner.