Generic selectors
Exact matches only
Search in title
Search in content
Post Type Selectors

Popular stocks

Crypto

CFD

Currencies

Support

Gold

NZD/USD – Technical Analysis – 4h

October 14, 2025 12:00

Quick Summary

The NZD chart shows a persistent downward trend, characterized by lower highs and lows. This pattern is further supported by technical indicators.

Traders should be cautious, as the asset is not showing strong bullish signs and current market sentiment remains bearish.

Candlestick Analysis

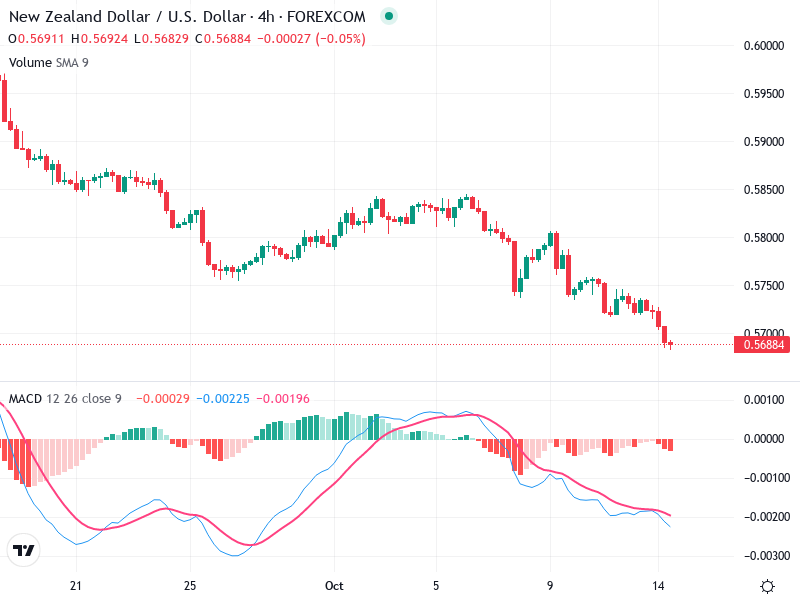
The overall trend is bearish, as indicated by the series of lower highs and lower lows.

There's a strong presence of red candlesticks, with few green, which emphasizes selling pressure.

No significant reversal candlestick patterns (like doji or hammer) appear at the recent lows, suggesting continued bearish sentiment.

MACD Analysis

The MACD line is below the Signal line, indicating a bearish crossover. The negative positioning suggests continued bearish momentum.

The MACD histogram is showing increasing negative bars, further emphasizing the strengthening bearish momentum.

No significant divergences are observed between MACD and price action, supporting the current trend direction.

Volume Analysis

Volume appears relatively stable without significant spikes.

This suggests that although there is a bearish trend, it is not currently supported by high selling volume, indicating the absence of strong institutional activity.

The lack of volume surge could mean that the downtrend isn't exceptionally strong, potentially waiting for further confirmation.

Support & Resistance

Key support seen around 0.5680. If this level is broken, it could lead to further downside.

Resistance is identified around 0.5750, where previous attempts to rally have failed.

Traders should closely monitor these levels for potential price action.

Actionable Insights

Given the bearish trend and MACD confirmation, traders might consider shorting opportunities on a confirmed break below the 0.5680 support.

Look for low-volume pullbacks into the 0.5750 resistance as potential sell points.

A sudden increase in volume on an upward reversal could indicate potential trend change and must be watched closely.

The AI Technical Analysis Center is an informational tool only and does not constitute investment or trading advice.
This site is registered on wpml.org as a development site. Switch to a production site key to remove this banner.