Generic selectors
Exact matches only
Search in title
Search in content
Post Type Selectors

Popular stocks

Crypto

CFD

Currencies

Support

Gold

AUD/USD – Technical Analysis – 4h

October 14, 2025 12:02

Quick Summary

The AUD/USD 4-hour chart reveals a consistent bearish trend characterized by lower highs and lower lows. Notably, the price has slipped below the previous support, indicating a continuation of downward momentum.

This trend is reinforced by both the MACD and volume analysis, which align with the overall bearish outlook.

Candlestick Analysis

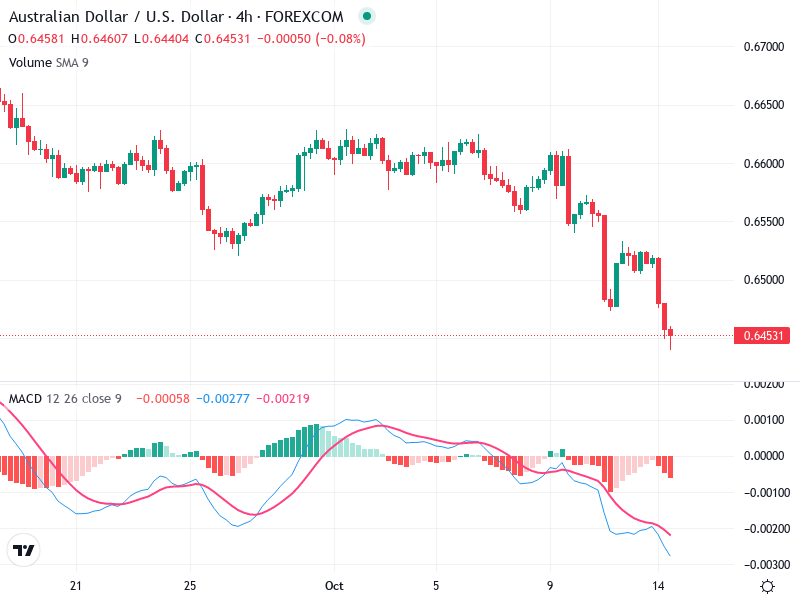
The chart exhibits a clear bearish trend, especially in the latter stages, with lower highs and lower lows.

There is a strong bearish candlestick sequence, indicating continuation of downward pressure. No distinct reversal patterns like doji or hammers are visible.

Prices have broken below prior support levels around 0.6500, suggesting potential continuation of the downtrend.

MACD Analysis

The MACD line is below the Signal line, confirming a bearish crossover, indicating downward momentum.

The histogram is in the negative territory, growing larger, which suggests strengthening bearish momentum.

No positive divergence visible; the MACD supports the current bearish price action.

Volume Analysis

The volume remains relatively consistent, but there are no significant spikes or drops that contradict the price movement.

Lack of volume spikes might indicate a gradual selling pressure without major institutional activity.

No unusual spikes to suggest any strong buying interest; volume aligns with the bearish trend.

Support & Resistance

Immediate support is visible around 0.6400. If broken, this could lead to further declines.

Resistance is strong near the 0.6500 mark, which has now become a pivotal level after a recent breakout.

This marks an area to watch for potential shift in momentum.

Actionable Insights

Considering entering sell positions on pullbacks to resistance around 0.6500, with a stop loss slightly above recent highs.

Those already in short positions may continue holding, given the trend and MACD configuration.

Watch for any signs of reversal candlesticks or MACD divergence as potential exit signals for short positions.

The AI Technical Analysis Center is an informational tool only and does not constitute investment or trading advice.
This site is registered on wpml.org as a development site. Switch to a production site key to remove this banner.