Generic selectors
Exact matches only
Search in title
Search in content
Post Type Selectors

Popular stocks

Crypto

CFD

Currencies

Support

Gold

NSDQ – Technical Analysis – 4h

October 15, 2025 07:01

Quick Summary

The asset’s chart displays recent fluctuations, highlighting key levels of support and resistance. The recent price movements suggest a potential shift in trend.

Technical indicators such as MACD and volume trends are instrumental in analyzing this asset.

Candlestick Analysis

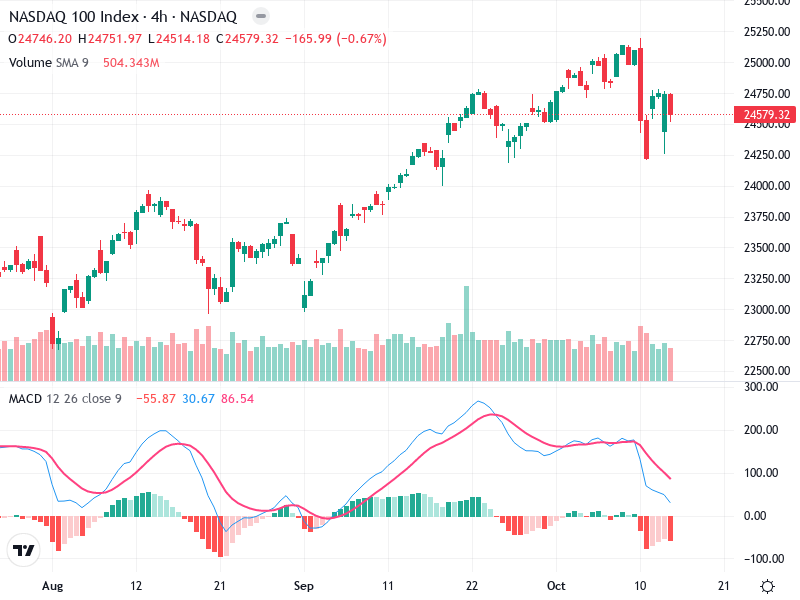
Recently, there is a notable bearish candlestick pattern reflecting strong selling pressure. Prior to this, there was a small consolidation period.

The trend appears to have been bullish up until the recent decline, indicating a potential reversal or significant pullback.

The area near the 24,500 level is acting as a pullback zone, as seen by buyers stepping in after the initial drop.

MACD Analysis

A bearish crossover has occurred between the MACD line and the Signal line, suggesting downward momentum.

The histogram is negative and declining, reinforcing bearish momentum.

There doesn't appear to be any significant divergences between the MACD and price action currently.

Volume Analysis

There is a noticeable increase in volume during the recent price drop, suggesting strong selling pressure, possibly indicating institutional involvement.

The high volume supports the bearish price action, lending credibility to the downward move.

The recent spike in volume during the decline is a key indicator of interest in the current price levels.

Support & Resistance

The 24,500 level previously served as a support area and remains critical for maintaining the current price action.

The 25,000 level is proving to be a recent resistance zone following the pullback.

Actionable Insights

A cautious approach is suggested given the recent bearish signals. Consider selling or holding if price breaks below the support level at 24,500 with volume confirmation.

Watch for confirmation of the bearish trend with sustained breakdowns below key support. Conversely, any reversal or bullish pattern formation above 24,500 could prompt re-evaluation.

Short-term sentiment appears bearish due to the MACD crossover and volume trends.

The AI Technical Analysis Center is an informational tool only and does not constitute investment or trading advice.
This site is registered on wpml.org as a development site. Switch to a production site key to remove this banner.