Generic selectors
Exact matches only
Search in title
Search in content
Post Type Selectors

Popular stocks

Crypto

CFD

Currencies

Support

Gold

EUR/USD – Technical Analysis – 4h

October 15, 2025 07:03

Quick Summary

The EUR/USD chart shows a potential turning point with recent bullish signals. Traders should pay close attention to key levels for confirmation of trends.

This analysis explores various indicators that suggest possible future movements in the asset.

Candlestick Analysis

The overall trend in the given timeframe is bearish, with lower highs and lower lows evident in the chart.

Recently, there is a bullish reversal pattern forming as suggested by the solid green candles pushing upwards, potentially indicating a pivot point in the trend.

There is a potential breakout if the price exceeds the recent high around 1.1650.

MACD Analysis

The MACD line is crossing above the Signal line, indicating a bullish crossover, which suggests potential upward momentum.

The histogram is moving into positive territory, further supporting bullish momentum and suggesting increasing strength.

There is no significant divergence between MACD and price action at the moment.

Volume Analysis

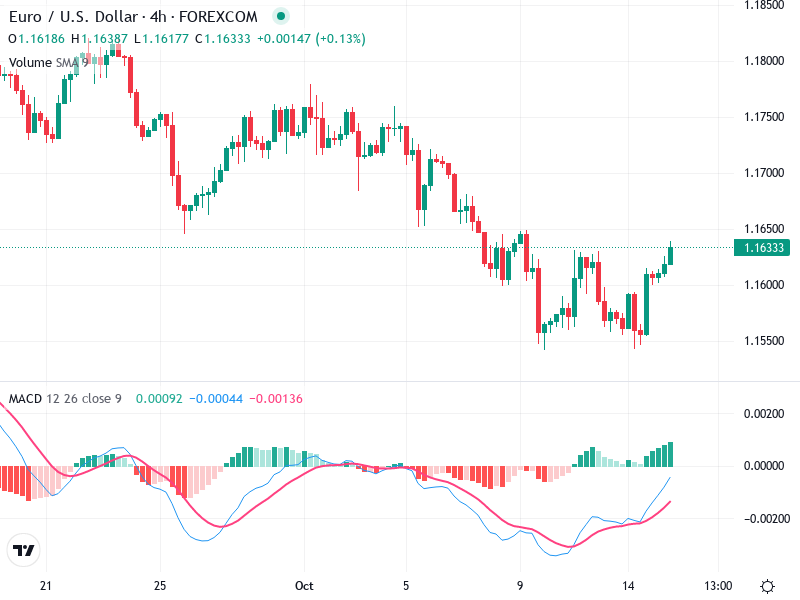
There has been a noticeable increase in volume corresponding with the recent bullish candles, suggesting strength behind the recent price movement.

The increased volume supports the price rise, indicating that this upward move may have some staying power.

The spike in volume could indicate institutional involvement, further strengthening the bullish case.

Support & Resistance

The immediate resistance level is at 1.1650, which will need to be breached for continued upside.

The significant support level is around 1.1560, which has held up previously.

Actionable Insights

Consider entering a long position on a confirmed breakout above 1.1650, with a stop loss slightly below 1.1560 to manage risk.

Current holders might want to maintain their positions, watching for confirmation of the breakout.

If price fails to hold above 1.1560, consider selling or scaling back long positions.

The AI Technical Analysis Center is an informational tool only and does not constitute investment or trading advice.
This site is registered on wpml.org as a development site. Switch to a production site key to remove this banner.