Generic selectors
Exact matches only
Search in title
Search in content
Post Type Selectors

Popular stocks

Crypto

CFD

Currencies

Support

Gold

GBP/USD – Technical Analysis – 4h

October 15, 2025 12:04

Quick Summary

The chart suggests a potential shift in trend for , as it attempts to move away from a recent downtrend.

The establishment of higher lows and the proximity to key resistance levels highlight critical decision points for upcoming movements.

Candlestick Analysis

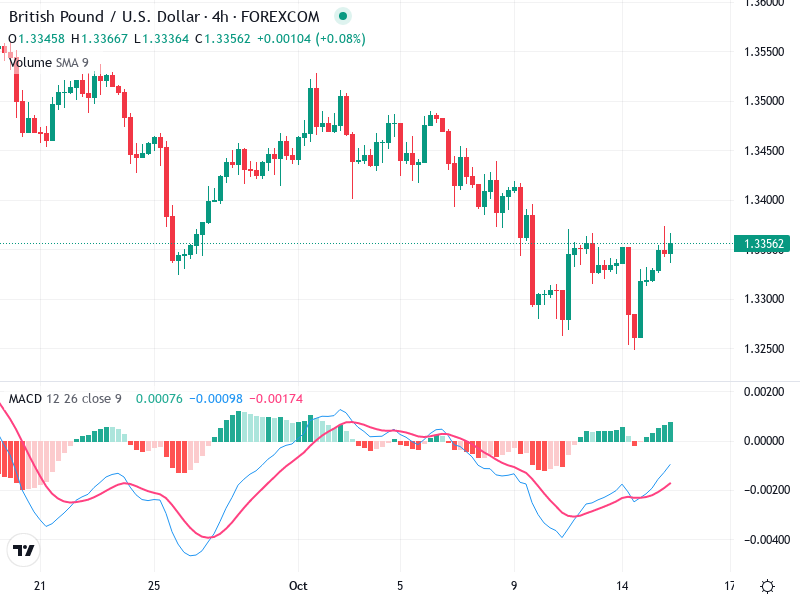
The chart shows potential reversal patterns like the hammer candlestick around the recent lows, indicating possible bullish momentum.

The recent trend is sideways to bullish after a significant downtrend, as the price is attempting to establish higher lows.

There is a potential breakout zone around the 1.3350 level, where the price is currently testing. A successful breakout could signify a trend continuation.

MACD Analysis

The MACD line has just crossed above the signal line, indicating a bullish crossover, which is often a buy signal.

The MACD histogram is increasing, suggesting a strengthening bullish momentum.

There doesn't appear to be a significant divergence between the MACD and price action currently.

Volume Analysis

The volume has shown spikes during the recent price rise, supporting the bullish move.

Increased volume during up candles indicates buying interest, likely providing further support to the price.

No unusually large volume spikes to suggest institutional activity, but increased volume can indicate strong interest.

Support & Resistance

Key support is around 1.3250, where the price previously rebounded.

The 1.3400 level acts as resistance and could be crucial for determining further upside movement.

These levels are pivotal for assessing potential breakout or reversal scenarios.

Actionable Insights

Consider buying if the price successfully breaks and holds above 1.3350 with sustained volume.

If the price fails to break 1.3350 or reverses with high volume, a short position could be considered.

Watch for confirmation of the breakout or potential failure to decide on holding long positions.

The AI Technical Analysis Center is an informational tool only and does not constitute investment or trading advice.
This site is registered on wpml.org as a development site. Switch to a production site key to remove this banner.