Generic selectors
Exact matches only
Search in title
Search in content
Post Type Selectors

Popular stocks

Crypto

CFD

Currencies

Support

Gold

NSDQ – Technical Analysis – 4h

October 16, 2025 07:00

Quick Summary

The chart for the Asset shows intriguing patterns that may point to future movements. Overall, it suggests a potential turnaround after recent market activity. The current indicators highlight key levels that traders should observe for signals on future directions.

Candlestick Analysis

The chart shows an overall bullish trend with higher highs and higher lows until a recent pullback.

Recent candlesticks suggest potential bullish reversal patterns after a pullback, such as a hammer or bullish engulfing, indicating a possible upturn.

Current candles show indecision, suggesting a potential pause before a further move.

MACD Analysis

The MACD line is below the Signal line, indicating a bearish phase. However, the lines are converging, which could suggest a potential bullish crossover in the near future.

The histogram is in negative territory but showing signs of reduction in bearish momentum, indicating a possible shift to bullish momentum if a crossover occurs.

No clear MACD divergence with price action at the moment.

Volume Analysis

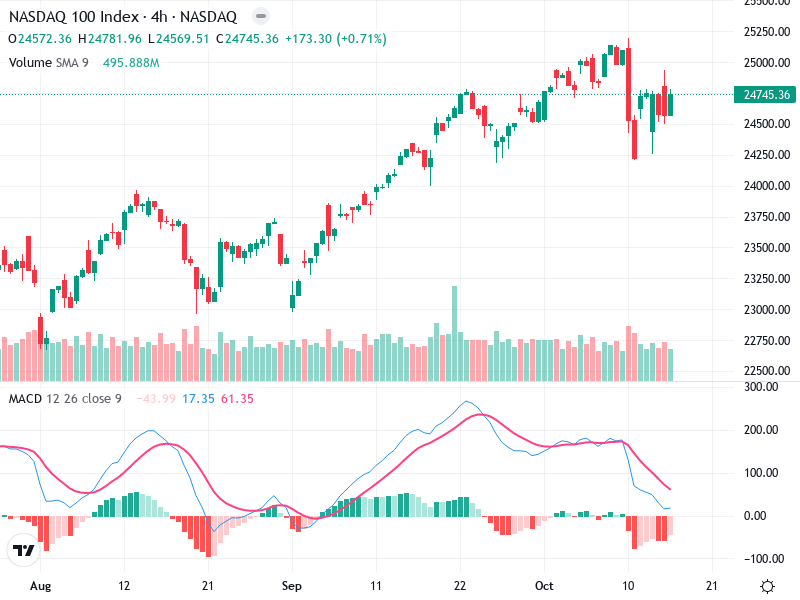
There is a notable volume spike during the recent pullback, suggesting increased selling pressure, but subsequent bars show reduced volume.

The decrease in volume on the recent price rise might suggest a lack of strong buying pressure, so watching volume for confirmation of the upward move is important.

The recent volume spike could indicate institutional activity, likely contributing to the pullback.

Support & Resistance

Around 24,200 is a key support zone, helping the recent price bounce.

The immediate resistance appears near the 25,000 level, where selling has previously increased.

These levels are critical for potential reversals or breakouts—watch for a strong move past resistance with volume for confirmation.

Actionable Insights

Look for a bullish MACD crossover or a breakout above the 25,000 resistance level with strong volume as a potential buy signal.

If the MACD fails to crossover and a breakdown below the 24,200 support occurs with volume, consider reducing exposure.

Keep an eye on volume increases and MACD activity for early indications of the next trend direction.

The AI Technical Analysis Center is an informational tool only and does not constitute investment or trading advice.
This site is registered on wpml.org as a development site. Switch to a production site key to remove this banner.