Generic selectors
Exact matches only
Search in title
Search in content
Post Type Selectors

Popular stocks

Crypto

CFD

Currencies

Support

Gold

EUR/USD – Technical Analysis – 4h

October 17, 2025 07:02

Quick Summary

The EUR/USD chart shows a significant bullish trend with recent upward momentum. The asset has reversed from a previous downtrend and is currently trading higher.

The technical indicators such as candlestick patterns and MACD align to support this positive outlook.

Candlestick Analysis

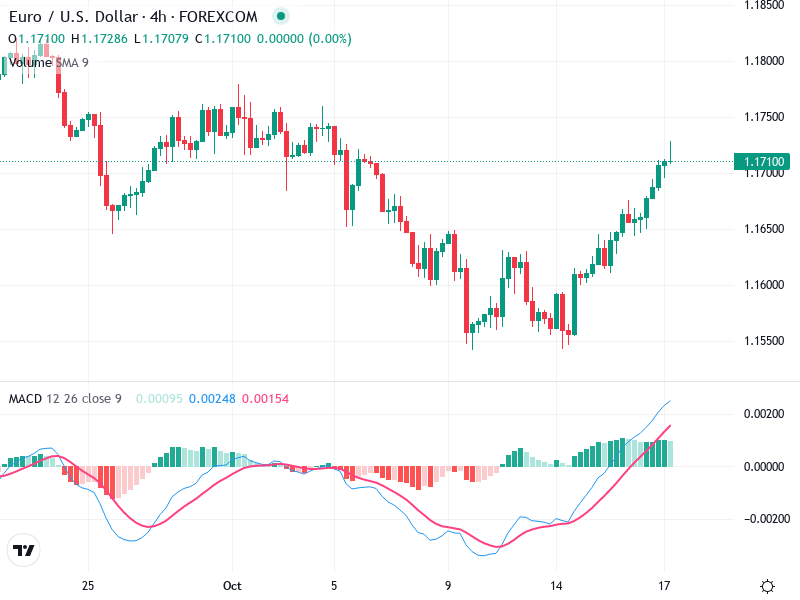
The recent trend shows a series of bullish candlesticks, indicating a strong upward momentum. There was a bullish engulfing pattern just before the current rise, suggesting a reversal from the previous downtrend.

The trend has shifted to bullish after a period of consolidation and decline. The price has been making higher highs and higher lows since the reversal.

The price has broken above a previous resistance level around 1.1650, which may now act as support.

MACD Analysis

There is a bullish crossover where the MACD line has crossed above the Signal line. This suggests a strong upward momentum.

The MACD histogram is increasing in the positive zone, which further supports the bullish momentum and indicates strengthening momentum.

No significant divergences observed at this moment between the MACD and price action, which suggests alignment in bullish sentiment.

Volume Analysis

There appears to be a moderate increase in volume during the recent upward move, which supports the bullish price action.

Consistent volume is slightly confirming the upward price movement, indicating that the move might have backing from traders.

No unusual spikes in volume, suggesting steady buying interest rather than sudden institutional activity.

Support & Resistance

Immediate support is at the level of 1.1650, as previously mentioned.

The next key resistance is around 1.1750. A break above this level would open further upside potential.

The analysis highlights these levels as crucial for guiding trading strategies.

Actionable Insights

Consider entering a long position if the price sustains above the 1.1650 level with upward momentum continuing.

Existing long positions could be held as long as key support levels are maintained.

Look for confirmation of a sustained break above 1.1750 for additional entry points and monitor the MACD for any loss of momentum or a bearish crossover as a potential exit signal.

The AI Technical Analysis Center is an informational tool only and does not constitute investment or trading advice.
This site is registered on wpml.org as a development site. Switch to a production site key to remove this banner.