Generic selectors
Exact matches only
Search in title
Search in content
Post Type Selectors

Popular stocks

Crypto

CFD

Currencies

Support

Gold

EUR/USD – Technical Analysis – 4h

October 20, 2025 07:03

Quick Summary

The EUR/USD 4-hour chart presents a detailed analysis utilizing various technical indicators. The analysis highlights key patterns and potential market movements. It’s crucial to consider both the technical and broader market conditions for a comprehensive understanding.

Candlestick Analysis

The chart shows a recent uptrend after a period of decline and consolidation. Currently, it appears there is a minor pullback.

There's a bullish engulfing pattern before the recent rise, indicating strong buying pressure.

Presence of a doji at the resistance, which can indicate indecision and a potential reversal.

MACD Analysis

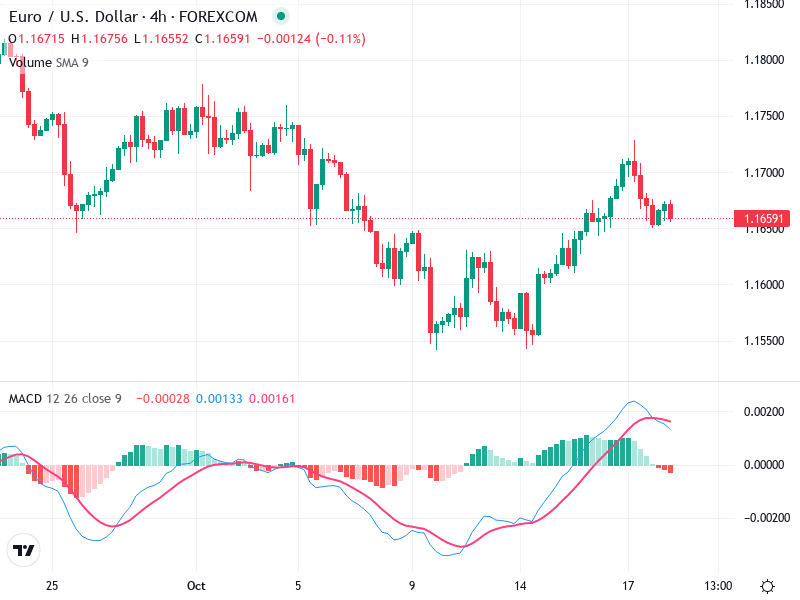
The MACD line has crossed below the Signal line, suggesting a bearish crossover, which typically indicates a potential for downward movement.

The histogram is currently negative, indicating waning bullish momentum.

Slight divergence could be inferred as the price made a higher high, but the MACD did not confirm this with a higher peak, signaling potential weakness.

Volume Analysis

There was an increase in volume during the rise, supporting the upward price movement.

Recently, volume appears to have decreased slightly, which may indicate a lack of conviction in the current pullback.

No significant volume spikes suggestive of heavy institutional activity at visible points on this chart.

Support & Resistance

Support is around 1.16000, which has been tested multiple times.

Resistance is at 1.17500, where the price recently failed to break through decisively.

If indecision persists, these levels are critical for determining future price action.

Actionable Insights

Consider buying if the price retraces to the support around 1.16000 and shows a reversal pattern like a hammer or bullish engulfing.

Current bearish crossover on the MACD suggests monitoring for potential selling opportunities if the price fails to break above 1.17500.

If indecision persists around current levels with decreasing volume, waiting for a clearer direction could be prudent.

The AI Technical Analysis Center is an informational tool only and does not constitute investment or trading advice.
This site is registered on wpml.org as a development site. Switch to a production site key to remove this banner.