Generic selectors
Exact matches only
Search in title
Search in content
Post Type Selectors

Popular stocks

Crypto

CFD

Currencies

Support

Gold

NZD/USD – Technical Analysis – 4h

October 20, 2025 12:00

Quick Summary

The chart depicts a period of consolidation after a bearish trend for the asset. The candlestick patterns indicate potential indecision that could lead to a breakout. Monitoring key levels like 0.57200 and 0.57400 can provide insights into future movements.

Candlestick Analysis

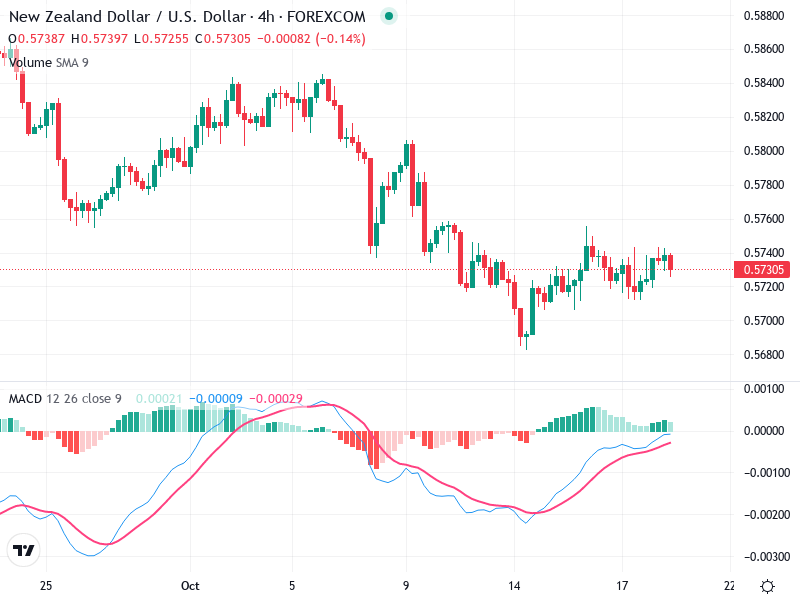
The overall trend appears to be bearish, followed by a period of consolidation.

There's evidence of bearish momentum in the initial decline, but recently, small-bodied candles suggest indecision, indicating a potential reversal or continuation of sideways movement.

The area around 0.57200 appears to be a potential support level, while resistance is visible near 0.57400.

MACD Analysis

There was a bearish crossover initially, but recently the MACD line has crossed above the Signal line, suggesting potential bullish momentum.

The histogram has been positive recently, indicating upward momentum. However, it's relatively shallow, suggesting limited strength.

No clear divergences between MACD and price action are immediately visible.

Volume Analysis

Volume remains relatively stable with no significant spikes, indicating low institutional activity. This supports the consolidation phase.

The low volume does not strongly confirm recent price movements, suggesting caution.

Monitoring any changes in volume can provide clues for potential breakout scenarios.

Support & Resistance

Around 0.57200, potential for a price bounce if tested.

Around 0.57400, which needs to be broken for bullish confirmation.

These levels are crucial for determining potential breakout or breakdown points.

Actionable Insights

Consider buying if there’s a confirmed breakout above the 0.57400 resistance with increasing volume.

If price fails to break resistance and shows bearish patterns or if MACD turns downward, selling might be advised.

Holding is advisable until a clear trend emerges given the current indecision.

The AI Technical Analysis Center is an informational tool only and does not constitute investment or trading advice.
This site is registered on wpml.org as a development site. Switch to a production site key to remove this banner.