Generic selectors
Exact matches only
Search in title
Search in content
Post Type Selectors

Popular stocks

Crypto

CFD

Currencies

Support

Gold

NSDQ – Technical Analysis – 4h

October 21, 2025 07:00

Quick Summary

The NASDAQ 100 has shown significant bullish trends with recent breakouts confirming upward momentum.

The price has broken through key resistance points, suggesting further potential upside.

Volume supports the bullish sentiment, indicating strong market interest.

Candlestick Analysis

The NASDAQ 100 index in the 4-hour chart displays an overall bullish trend with higher highs and higher lows, despite some consolidation periods.

Recently, there is a potential bullish breakout with the price moving above previous resistance levels.

The candlesticks preceding this breakout show bullish momentum with larger green bodies.

MACD Analysis

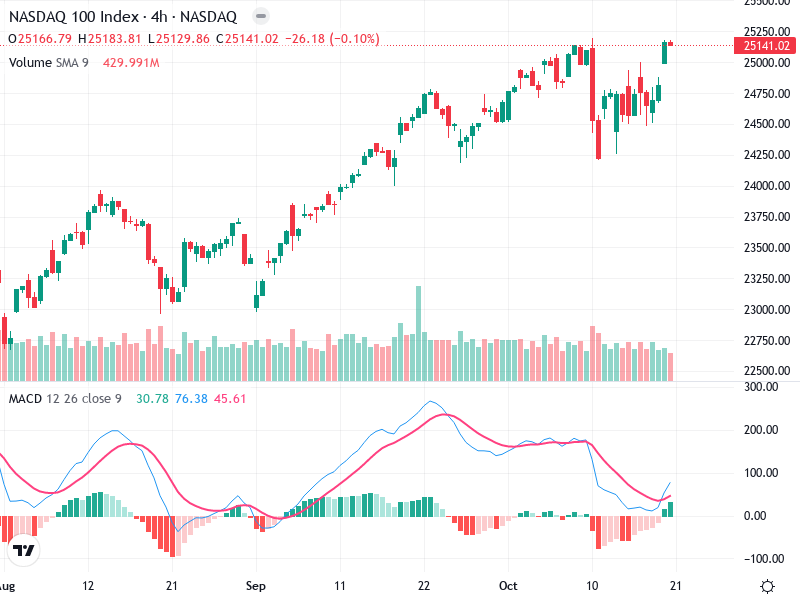
The MACD line is above the Signal line, indicating a bullish crossover has occurred. This suggests a potential continuation of upward momentum.

The histogram shows increasing green bars, reflecting growing bullish momentum.

Currently, there is no significant divergence between the MACD and price action, supporting the recent upward move.

Volume Analysis

There is a noticeable increase in volume during the recent upward price movement, supporting the validity of the breakout.

An unusual spike in volume occurs around October 10th, suggesting potential institutional involvement.

The increased volume aligns with price increases, confirming bullish sentiment.

Support & Resistance

Key support is now around the 25000 level, previously a resistance. This level is crucial for sustaining bullish momentum.

The next major resistance is near 25300, where previous tops have occurred.

A breakout above this could signal further bullish action.

Actionable Insights

Consider entering a long position if the price remains above the 25000 support, with a target towards the 25300 level.

If the price closes below 25000 with high volume, it may signal a false breakout, presenting a selling opportunity.

Look for confirmation above the 25300 level with continued volume support for a stronger bullish signal. Be cautious of any reversal patterns forming near resistance.

The AI Technical Analysis Center is an informational tool only and does not constitute investment or trading advice.
This site is registered on wpml.org as a development site. Switch to a production site key to remove this banner.