Generic selectors
Exact matches only
Search in title
Search in content
Post Type Selectors

Popular stocks

Crypto

CFD

Currencies

Support

Gold

AUD/USD – Technical Analysis – 4h

October 21, 2025 12:03

Quick Summary

The AUD/USD 4-hour chart presents a nuanced view of market sentiment, predominantly characterized by sideways movement with slight bearish tendencies. Resistance and support levels are critical in defining the trading range.

The asset shows potential near-term movements contingent on these technical thresholds.

Candlestick Analysis

The chart shows a mix of bullish and bearish candlesticks with no strong pattern dominance.

A small bullish engulfing pattern is noticeable earlier in the chart, indicative of a potential short-term bullish reversal.

Key zones reflecting breakout or pullback tendencies are around 0.6540 as resistance and 0.6460 as support, with prices appearing range-bound within these levels.

MACD Analysis

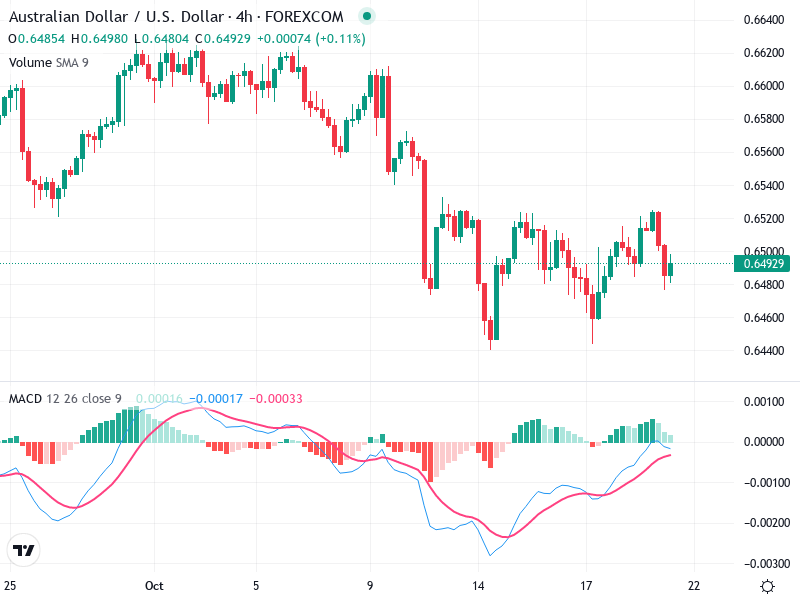
The MACD line is slightly above the Signal line, suggesting mild bullish momentum; however, it is not strongly confirmed due to the closeness of the lines.

The histogram shows decreasing positive momentum, indicating potential weakening of bullish sentiment.

There is no clear divergence between MACD and price action, suggesting current movements align with broader momentum.

Volume Analysis

Trading volume is generally consistent with no significant spikes, indicating lack of strong institutional activity.

The steady volume supports the sideways price action, with no strong conviction in either direction.

This volume profile confirms the market's range-bound posture.

Support & Resistance

Key support is identified at 0.6460, where previous candles have shown buying interest.

Resistance is noted near 0.6540, aligning with recent highs.

Breaching either level with volume could signal a stronger directional move.

Actionable Insights

Consider buying on confirmation of a breakout above 0.6540 with increased volume.

Watch for potential short opportunities if the price breaks and closes below 0.6460.

Maintain a neutral stance if the price continues to fluctuate between these levels.

The AI Technical Analysis Center is an informational tool only and does not constitute investment or trading advice.
This site is registered on wpml.org as a development site. Switch to a production site key to remove this banner.