Generic selectors
Exact matches only
Search in title
Search in content
Post Type Selectors

Popular stocks

Crypto

CFD

Currencies

Support

Gold

NSDQ – Technical Analysis – 4h

October 22, 2025 07:00

Quick Summary

The NASDAQ 100 Index 4h chart displays key insights for traders. It highlights technical indicators that suggest emerging trends.

The analysis covers potential breakouts and support levels, providing a comprehensive outlook.

Candlestick Analysis

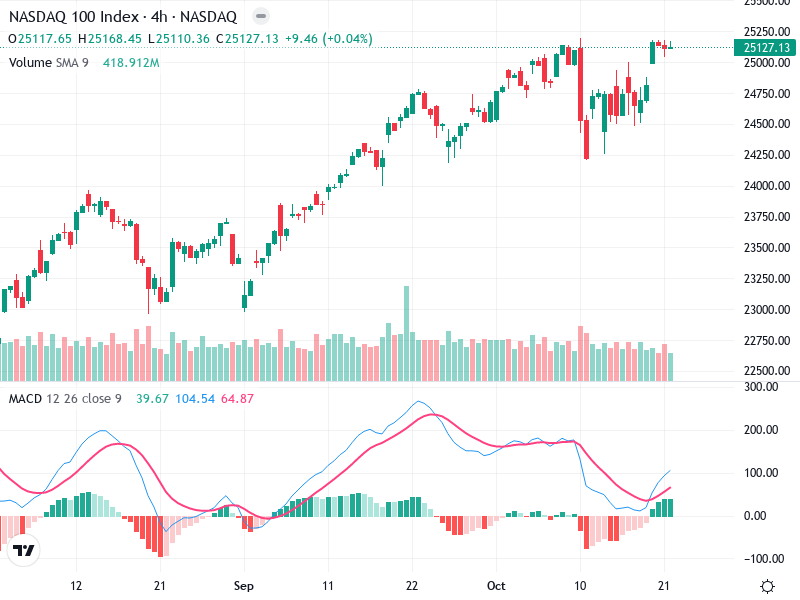
The chart shows a generally bullish trend with higher highs and higher lows. Recently, there was a pullback, but the price seems to be attempting a recovery.

A potential bullish engulfing pattern appears to be forming, suggesting a possible reversal to the upside after the recent bearish candlesticks.

The index is testing the resistance around 25,150. A successful close above this level on increased volume might confirm a breakout.

MACD Analysis

The MACD line is above the Signal line, indicating a bullish crossover. This suggests upward momentum could be building.

The histogram is positive and increasing, which supports the idea of strengthening bullish momentum.

No significant divergence observed between the MACD and the price, indicating the momentum aligns with the price movement.

Volume Analysis

There was a noticeable increase in volume during recent declines, which could indicate selling pressure. However, recent volume levels have moderated.

The current recovery in price is occurring on moderate volume. A strong breakout above resistance would be more credible if accompanied by higher volume.

There were spikes in volume during recent downturns, often suggesting potential institutional selling.

Support & Resistance

The key resistance zone is around 25,150. Successful penetration may push the index higher.

Strong support appears near 24,750. A drop below this level could indicate further downside potential.

Monitoring these levels will be crucial in determining future price action in the short term.

Actionable Insights

Consider buying if the price closes above 25,150 with strong volume, confirming a breakout.

Watch for a move below 24,750 to consider shorting or lightening positions.

Those already long might consider holding, while watching if the resistance break confirms.

The AI Technical Analysis Center is an informational tool only and does not constitute investment or trading advice.
This site is registered on wpml.org as a development site. Switch to a production site key to remove this banner.