Generic selectors
Exact matches only
Search in title
Search in content
Post Type Selectors

Popular stocks

Crypto

CFD

Currencies

Support

Gold

EUR/USD – Technical Analysis – 4h

October 22, 2025 07:02

Quick Summary

The EUR/USD chart is exhibiting several noteworthy technical patterns that merit close observation.

The presence of a bullish engulfing candlestick suggests potential momentum shifts.

Key technical indicators, including MACD and volume, are pointing towards a possible trend change.

Candlestick Analysis

There is a bullish engulfing pattern visible on the chart, indicating a potential reversal from the recent bearish trend.

The pair has recently experienced a downtrend, but the presence of the bullish candlestick suggests a possible change in momentum.

The area around 1.1600 serves as a potential pivot point. A break above could signal a reversal.

MACD Analysis

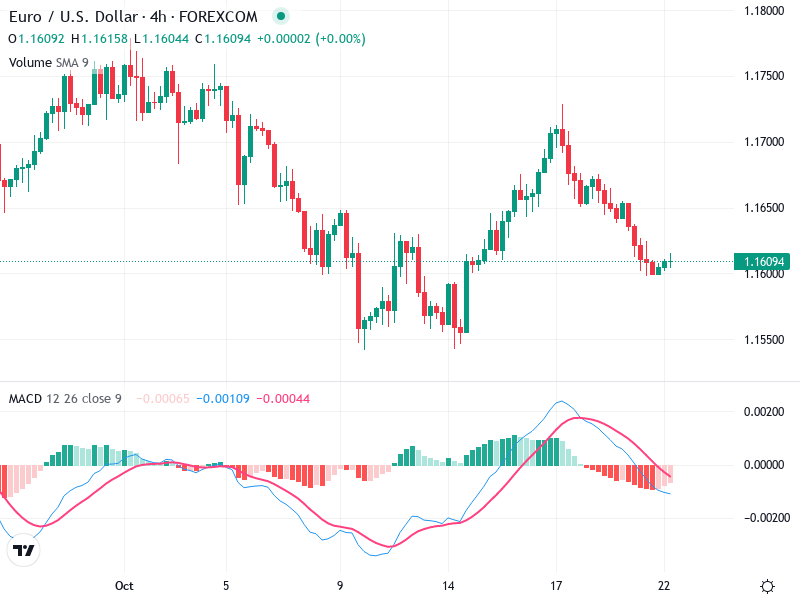
The MACD line is currently below the Signal line, which is a bearish indication, but it appears to be converging, suggesting weakening downward momentum.

The MACD histogram is showing diminishing bearish momentum, which might lead to a crossover.

There’s a possible bullish divergence emerging as the price forms new lows while the MACD does not, indicating a potential reversal.

Volume Analysis

The volume appears relatively stable with no significant spikes.

The stable volume suggests that the recent price changes are not strongly supported by trading activity, indicating caution.

No unusual volume spikes suggest the absence of significant institutional activity currently.

Support & Resistance

Strong support is around the 1.1550 level, which has acted as a base in recent trading.

A key resistance level to watch is 1.1650, where previous bullish momentum stalled.

Monitoring these levels can provide clues for potential breakouts or reversals.

Actionable Insights

Consider buying if price confirms a bullish crossover in MACD along with a breakout above 1.1650.

Look to sell if the pair falls back towards 1.1550 with renewed volume.

Hold or monitor for confirmation signals regarding the MACD crossover and price action above or below key levels.

The AI Technical Analysis Center is an informational tool only and does not constitute investment or trading advice.
This site is registered on wpml.org as a development site. Switch to a production site key to remove this banner.