Generic selectors
Exact matches only
Search in title
Search in content
Post Type Selectors

Popular stocks

Crypto

CFD

Currencies

Support

Gold

EUR/USD – Technical Analysis – 4h

October 23, 2025 07:03

Quick Summary

The EUR/USD chart displays a bearish trend following a recent peak. There is dominant selling pressure and careful monitoring of support levels and MACD signals is recommended. The asset is currently in a bearish phase with consistent lower highs and lower lows.

Candlestick Analysis

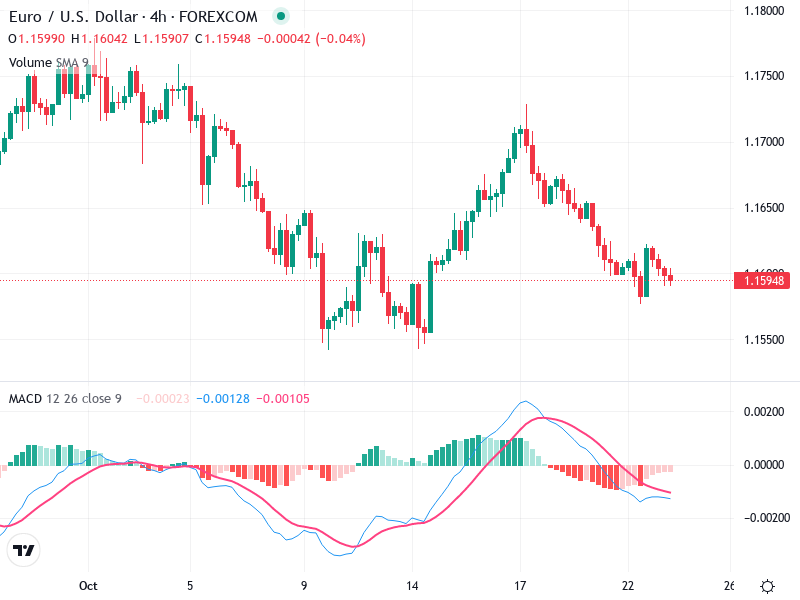
The chart shows a bearish trend following a recent peak around the 1.1700 level.

There is no prominent bullish pattern currently, but prior to the decline, a bearish engulfing pattern was visible, indicating a reversal from the uptrend.

The recent decline below the 1.1650 support level confirmed a bearish breakout. The price is currently consolidating around 1.1595, which might act as a new resistance if the price attempts to rise.

MACD Analysis

The MACD line is below the Signal line, indicating a bearish crossover which aligns with the recent downtrend.

The histogram remains negative, showing that bearish momentum continues. However, it appears to be narrowing, suggesting a potential decrease in bearish momentum.

There is no visible divergence between the MACD and the price action at the moment.

Volume Analysis

The volume has increased during the recent drop, indicating strong selling pressure.

The high volume during the decline supports the bearish trend.

No unusual spikes in volume are currently present, suggesting typical trading activity rather than large institutional moves.

Support & Resistance

Key support is seen around 1.1550, a previous resistance turned support.

Immediate resistance is at 1.1650, where the breakout occurred, and further resistance is noted at 1.1700.

Actionable Insights

Traders can consider selling rallies towards 1.1650 with stop-loss just above recent highs.

If holding short positions, continue to do so while monitoring for a reversal or breakout confirmations.

Cautious traders can wait for a clear reversal signal above 1.1650 before entering long positions.

The AI Technical Analysis Center is an informational tool only and does not constitute investment or trading advice.
This site is registered on wpml.org as a development site. Switch to a production site key to remove this banner.