Generic selectors
Exact matches only
Search in title
Search in content
Post Type Selectors

Popular stocks

Crypto

CFD

Currencies

Support

Gold

NSDQ – Technical Analysis – 4h

October 24, 2025 07:01

Quick Summary

The NASDAQ 100 Index chart shows a strong bullish trend, with higher highs and higher lows.

Recent price movements suggest upward momentum, supported by technical indicators.

Candlestick Analysis

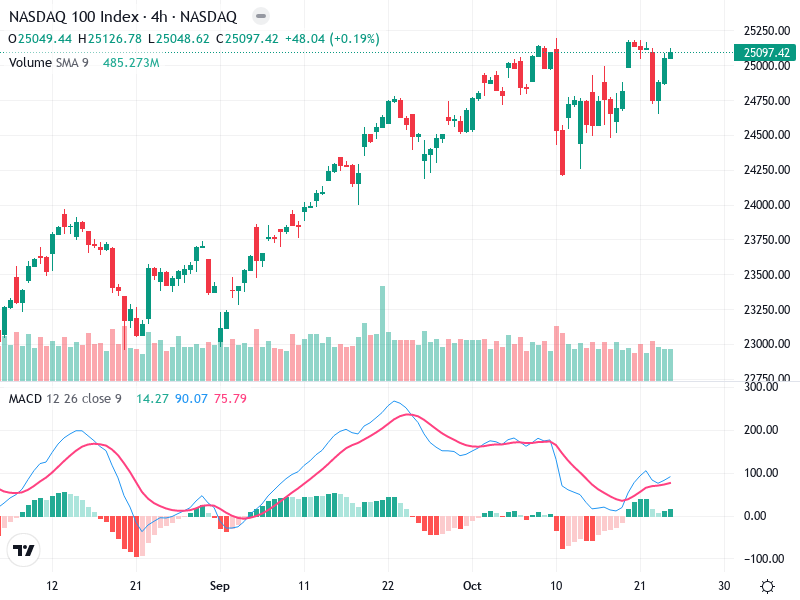
The overall trend appears bullish, with higher highs and higher lows, indicating upward momentum.

The chart shows a strong recovery after a brief pullback, with recent bullish candlesticks that reinforce buying pressure.

The price is trying to break out above the 25,100 resistance level, which is a key area to watch for sustained bullish momentum.

MACD Analysis

The MACD line is above the Signal line, suggesting a recent bullish crossover which indicates upward momentum.

The positive values on the histogram suggest increasing bullish momentum.

No significant divergences are observed between the MACD and price action, supporting the current trend.

Volume Analysis

There is a moderate volume spike supporting recent upward price movements, indicating genuine buying interest.

The increase in price with accompanying volume suggests that the bullish move has strength.

While not extremely high, the volume is sufficient to suggest some level of institutional participation in the current trend.

Support & Resistance

Key support is around the 24,500 level, where previous dips found buying interest.

Immediate resistance is at 25,100. A clear breakout above this level may lead to further bullish extension.

Watching these levels can provide insights into potential market movements.

Actionable Insights

Consider buying if there is a breakout above the 25,100 level with confidence, confirmed by volume.

Be cautious of any reversal signs like bearish candlesticks near resistance, as it might indicate a false breakout.

Holding is advisable if already in a position, given the bullish momentum, unless a clear reversal pattern emerges.

The AI Technical Analysis Center is an informational tool only and does not constitute investment or trading advice.
This site is registered on wpml.org as a development site. Switch to a production site key to remove this banner.