Generic selectors
Exact matches only
Search in title
Search in content
Post Type Selectors

Popular stocks

Crypto

CFD

Currencies

Support

Gold

EUR/USD – Technical Analysis – 4h

October 24, 2025 07:03

Quick Summary

The EUR/USD 4-hour chart depicts a consolidation phase following a significant downward movement. The currency pair is attempting to stabilize around key support levels. However, the potential for upward momentum is being observed.

Candlestick Analysis

The chart shows a recent downtrend following a peak around 1.17500, but there is a current stabilization around 1.16144. The overall trend has shifted to sideways after the sharp drop.

There are small-bodied candles presently, which indicate indecisiveness in the market as of the current price.

The area around 1.16000 appears to be a stabilizing zone post the recent bearish movement.

MACD Analysis

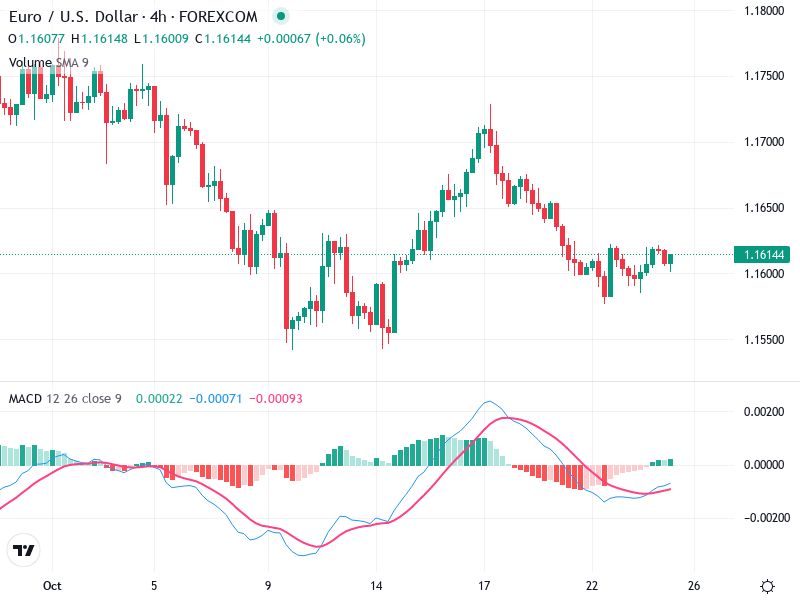
The MACD line (blue) is crossing above the Signal line (red), suggesting a bullish crossover. This can be an early indication of a potential upward momentum.

The MACD histogram is turning positive, which supports the potential for developing bullish momentum.

There isn’t a significant divergence between the MACD and price action currently, but the crossover suggests potential bullish momentum building.

Volume Analysis

Volume spikes coincide with both downward and upward movements, indicating strong participation during volatile periods.

No significant volume spikes in the most recent candles; this implies that traders may be waiting for more information before committing.

Current volume patterns suggest caution among traders.

Support & Resistance

Roughly around 1.15500, where prior downtrends have found footing.

Approximately at 1.16500, where recent attempts to rise have faced rejection.

Breaching these levels with strong volume could indicate further directional bias.

Actionable Insights

Consider entry if the price breaks above the 1.16500 resistance with strong volume and MACD support.

Potential selling could be advised if the price closes below 1.15500 with increased bearish volume.

Monitor for further MACD confirmations or a clear trend direction breakout.

The AI Technical Analysis Center is an informational tool only and does not constitute investment or trading advice.
This site is registered on wpml.org as a development site. Switch to a production site key to remove this banner.