Generic selectors
Exact matches only
Search in title
Search in content
Post Type Selectors

Popular stocks

Crypto

CFD

Currencies

Support

Gold

NZD/USD – Technical Analysis – 4h

October 24, 2025 12:00

Quick Summary

The asset chart reveals a complex interplay of market forces. While momentum appears weak, key levels have emerged, potentially shaping future movements.

Monitoring these levels alongside volume and momentum indicators will be essential for traders.

Candlestick Analysis

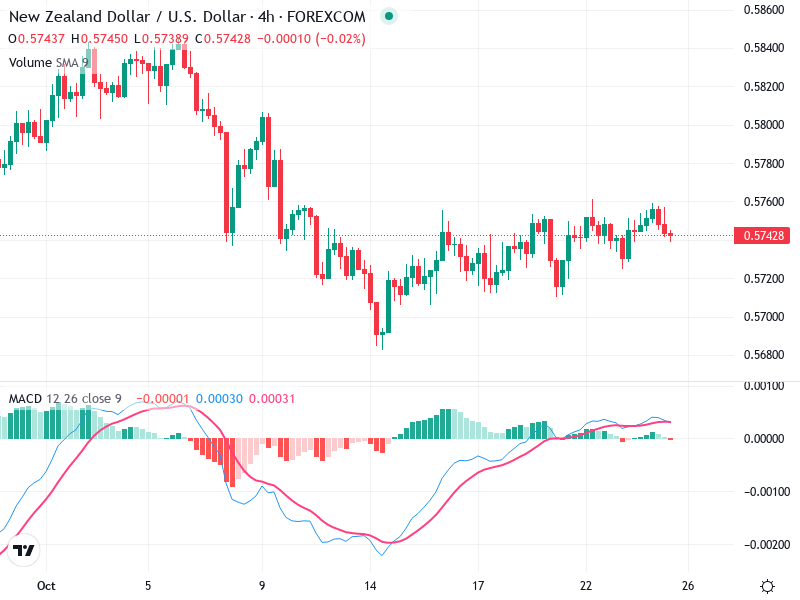
The chart indicates a transition from a bearish trend to a more sideways or potentially bullish trend in the recent period.

No clear significant candlestick patterns (e.g., bullish engulfing, hammer) are observed, but there are small doji and spinning top candles indicating indecisiveness in the market, especially towards the end.

There was a notable resistance around 0.57600, which has been tested multiple times but not convincingly broken through.

MACD Analysis

The MACD line is slightly above the Signal line, suggesting a recent bullish crossover; however, they are close, indicating weak bullish momentum.

The histogram shows diminishing bullish momentum, consistent with the recent reduction in upward price movement.

No strong divergence is observed between MACD and price action, but the momentum is weak.

Volume Analysis

There wasn't a significant increase in volume during the most recent price movements, indicating a lack of strong conviction in either direction.

The volume does not strongly support the mild bullish correction as it remains relatively stable—suggesting caution.

No unusual spikes suggestive of institutional activity are present.

Support & Resistance

The primary resistance appears around 0.57600.

The support is around the 0.57250 level, providing a floor for recent price consolidations.

Breaking through these levels with volume could signal future price direction.

Actionable Insights

A conservative approach suggests a hold strategy until clearer signals emerge. Consider buying if the price breaks significantly above 0.57600 with increased volume.

Additional confirmation signals such as a strong bullish crossover in MACD and increased volume on breakouts from current consolidation zones should be watched for.

Traders should remain vigilant for increased volume and ensuring confirmation of any breakout or trend reversals before taking significant positions.

The AI Technical Analysis Center is an informational tool only and does not constitute investment or trading advice.
This site is registered on wpml.org as a development site. Switch to a production site key to remove this banner.