Generic selectors
Exact matches only
Search in title
Search in content
Post Type Selectors

Popular stocks

Crypto

CFD

Currencies

Support

Gold

AUD/USD – Technical Analysis – 4h

October 24, 2025 12:02

Quick Summary

The AUD/USD 4-hour chart reveals a sideways trend where prices have been oscillating between key levels, indicating consolidation.

The market currently shows no definitive bullish or bearish trend, and traders should watch for breakouts.

Candlestick Analysis

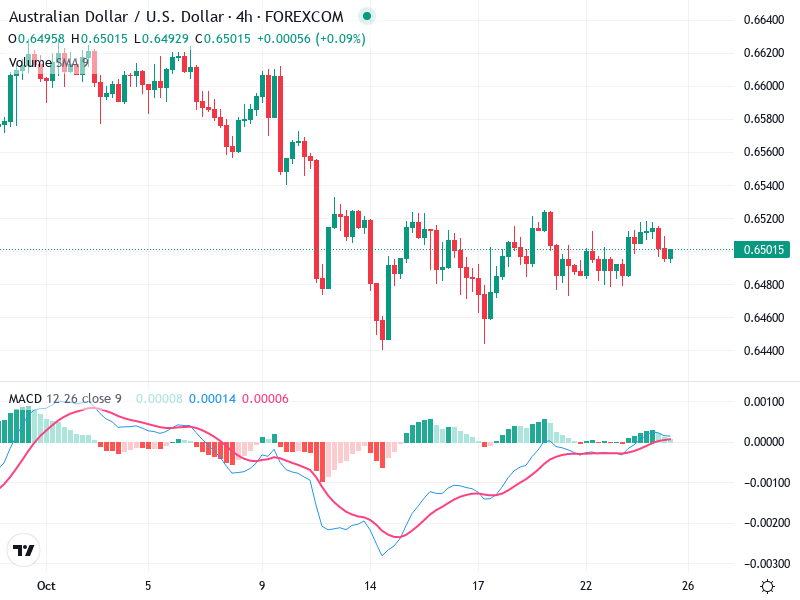
No major candlestick patterns like bullish engulfing, dojis, or hammers are immediately apparent in the recent sessions.

The recent trend appears sideways, with prices oscillating between approximately 0.6480 to 0.6520. There is no clear bullish or bearish trend, suggesting consolidation.

Resistance is evident around 0.6520, with support around 0.6480. Watch these zones for any breakout or pullback opportunities.

MACD Analysis

The MACD line is close to the signal line, indicating a lack of strong momentum. There is a potential for a bullish crossover, but it has not yet materialized.

The histogram is currently slightly positive but close to zero, suggesting weak bullish momentum.

No clear divergence is observed between the MACD and price action.

Volume Analysis

Volume appears stable with no significant spikes. This stability suggests low conviction among traders, aligning with the sideways price activity.

The stable volume does not confirm any strong buying or selling pressure, consistent with the lack of a definitive trend.

No unusual spikes in volume suggest a lack of institutional activity.

Support & Resistance

Key support is around 0.6480. If prices break below this level, further downside can be expected.

Significant resistance is at 0.6520. A breakout above this could signal a shift to bullish sentiment.

This range of support and resistance is crucial for traders to watch for breakout opportunities.

Actionable Insights

Traders may consider entering positions on a confirmed breakout above resistance or below support.

No strong buy or sell signals are present at the moment, indicating a wait-and-see approach until clearer signals arise.

Monitor for a potential MACD crossover or significant volume change for directional clues.

The AI Technical Analysis Center is an informational tool only and does not constitute investment or trading advice.
This site is registered on wpml.org as a development site. Switch to a production site key to remove this banner.