Generic selectors
Exact matches only
Search in title
Search in content
Post Type Selectors

Popular stocks

Crypto

CFD

Currencies

Support

Gold

GBP/USD – Technical Analysis – 4h

October 24, 2025 12:04

Quick Summary

The chart indicates a possible shift in the market trend.

Currently, the asset appears to be experiencing bearish momentum.

Candlestick Analysis

The chart shows a recent downtrend after a period of upward movement. The current price action is mostly bearish, indicated by a series of red candles.

No strong reversal patterns like bullish engulfing or hammer are visible. Several doji candles appear, suggesting indecision and a possible pause or reversal.

There is a potential support around 1.3300, where the price might stabilize or reverse.

MACD Analysis

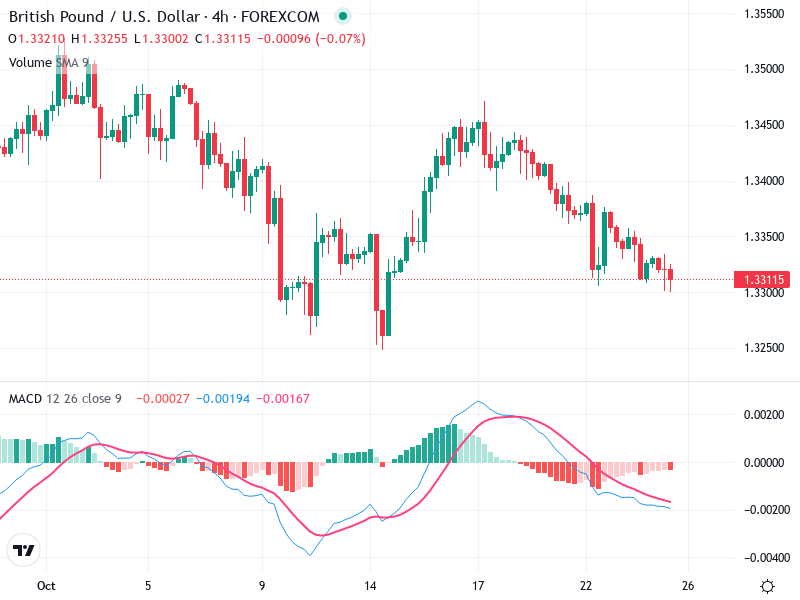
The MACD line is below the Signal line, indicating a bearish crossover that suggests continued downward momentum.

The histogram is negative, showing bearish momentum, though the bars are getting shorter, indicating a potential slowing of the downtrend.

No clear bullish or bearish divergence between the MACD and price action is observed.

Volume Analysis

There is no significant volume spike to suggest strong institutional activity at the current level.

Volume has been moderate, which generally supports the current price trend without indicating an imminent reversal.

Notable volume increases could precede reversals or continuation patterns, so watch for future spikes.

Support & Resistance

Key support is around the 1.3300 level, which could act as a potential reversal zone.

Previous highs around 1.3450 might serve as significant resistance if the price attempts to rally.

Important areas to note for potential price reversal or continuation.

Actionable Insights

Wait for confirmation before entering long positions due to the current bearish momentum.

Watch for possible reversal signs at key support levels with any bullish candlestick patterns or a bullish MACD crossover.

If the price breaks below the 1.3300 support with volume, further declines could occur.

The AI Technical Analysis Center is an informational tool only and does not constitute investment or trading advice.
This site is registered on wpml.org as a development site. Switch to a production site key to remove this banner.