Generic selectors
Exact matches only
Search in title
Search in content
Post Type Selectors

Popular stocks

Crypto

CFD

Currencies

Support

Gold

EUR/USD – Technical Analysis – 4h

October 27, 2025 08:02

Quick Summary

The chart displays the with notable shifts from bearish to sideways trends. Observations highlight significant levels for potential breakouts and traders should be aware of MACD signals. Careful attention to volume trends will aid in assessing market sentiment and activity.

Candlestick Analysis

The chart depicts a bearish trend initially, followed by a shift to a more sideways movement.

Notable patterns include potential doji formations around the middle of the chart, indicating indecision in the market.

The chart begins with a bearish trend that transitions into a more neutral sideways trend. The recent candlesticks suggest consolidation around the 1.16195 level.

MACD Analysis

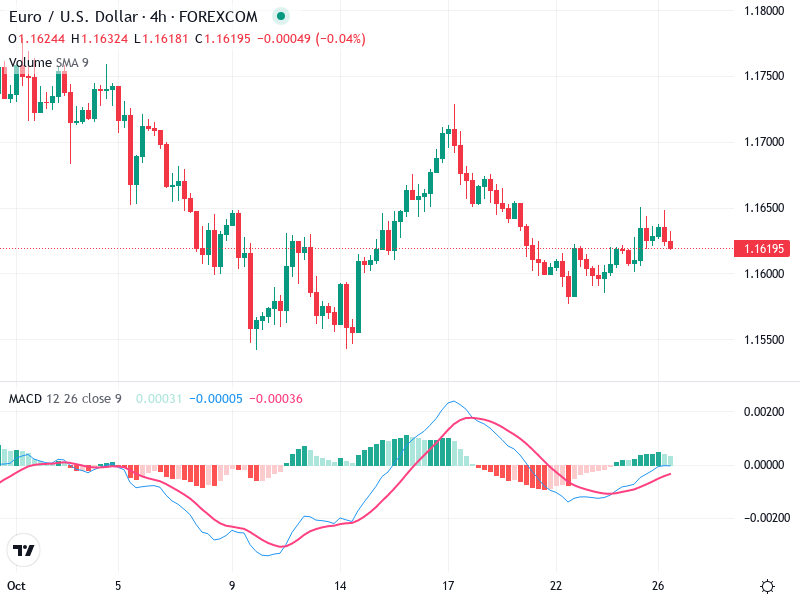
The MACD line is slightly below the signal line, suggesting recent bearish momentum, though not strong.

However, they are close to converging, hinting at a potential bullish crossover if momentum shifts.

The histogram shows decreasing negative momentum, suggesting possible bullish divergence if the trend continues.

Volume Analysis

The volume appears relatively stable with no significant spikes, indicating a lack of strong conviction from the market participants.

Current volume levels do not strongly support a definitive upward or downward move.

No unusual spikes suggest limited institutional activity recently.

Support & Resistance

Key support is around 1.1600, providing a base where buyers might step in.

Resistance is formed near 1.1650, which the price needs to break for further bullish action.

Look for a breakout above 1.1650 or a drop below 1.1600 for potential trading opportunities.

Actionable Insights

Consider a wait-and-see approach until a clear breakout from the identified ranges.

Possible buy signals upon a breakout above 1.1650, while selling could be considered on a drop below 1.1600.

Beware of false breakouts in low-volume conditions.

The AI Technical Analysis Center is an informational tool only and does not constitute investment or trading advice.
This site is registered on wpml.org as a development site. Switch to a production site key to remove this banner.