Generic selectors
Exact matches only
Search in title
Search in content
Post Type Selectors

Popular stocks

Crypto

CFD

Currencies

Support

Gold

AUD/USD – Technical Analysis – 4h

October 27, 2025 13:02

Quick Summary

The AUD/USD chart is showing signs of a bullish shift, with recent price action indicating potential upward momentum. A break above key resistance levels suggests further gains may be ahead. Pay close attention to support levels for confirmation of this trend.

Candlestick Analysis

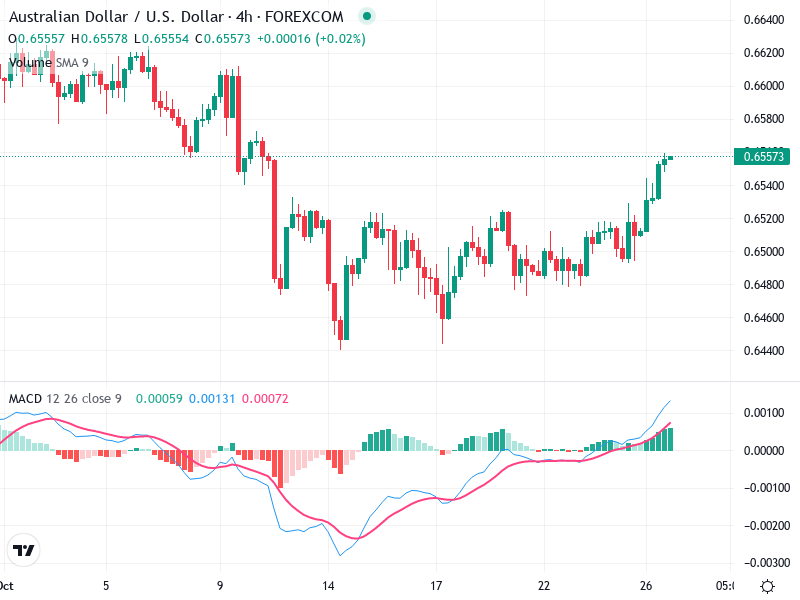
The overall trend appears to have shifted from bearish to bullish in the short term, with a series of higher highs and higher lows forming.

No distinct single candlestick patterns like doji or hammer are observed. However, there are bullish engulfing formations at the recent low, indicating a potential trend reversal.

The price has recently broken above a notable resistance around 0.6550, indicating bullish momentum.

MACD Analysis

A bullish crossover occurred recently, with the MACD line crossing above the signal line and staying above, suggesting increasing bullish momentum.

The MACD histogram bars are positive and increasing in size, supporting the bullish sentiment as momentum builds.

There appears to be no significant divergence between the MACD and price action, indicating the trend is supported by momentum.

Volume Analysis

Volume appears to be increasing slightly during the recent upward price movements, confirming the bullish trend.

No unusual spikes indicate the absence of sudden institutional activity; however, volume supports the positive price action.

The gradual increase in volume is consistent with the upward trend, lending further credibility to the recent price movements.

Support & Resistance

Key support can be identified around the 0.6480 level, where previous consolidations occurred.

Immediate resistance could be ahead near the 0.6580 level, as the price approaches previous highs.

Monitoring these levels is crucial for gauging the potential continuation or reversal of the current trend.

Actionable Insights

Consider buying on pullbacks near the support of 0.6520 to 0.6480, with a stop loss below the key support level at 0.6480.

If the price consolidates above 0.6580, it would confirm the continuation of the bullish trend.

A break below 0.6480 could negate the current bullish setup and suggest a change in trend.

The AI Technical Analysis Center is an informational tool only and does not constitute investment or trading advice.
This site is registered on wpml.org as a development site. Switch to a production site key to remove this banner.