Generic selectors
Exact matches only
Search in title
Search in content
Post Type Selectors

Popular stocks

Crypto

CFD

Currencies

Support

Gold

OIL – Technical Analysis – 4h

October 27, 2025 17:01

Quick Summary

The recent analysis of reveals a chart characterized by varying trends.

After a significant uptrend, the asset is currently experiencing a consolidation phase around the $61.60 mark.

This phase of indecision could indicate future direction shifts.

Candlestick Analysis

The candlestick patterns reveal a consolidation phase marked by small-bodied candles suggesting indecision.

Earlier, there was a strong bullish trend evidenced by a series of green candles.

The chart is in a short-term consolidation around the $61.60 level after a bullish trend following a prior downtrend.

MACD Analysis

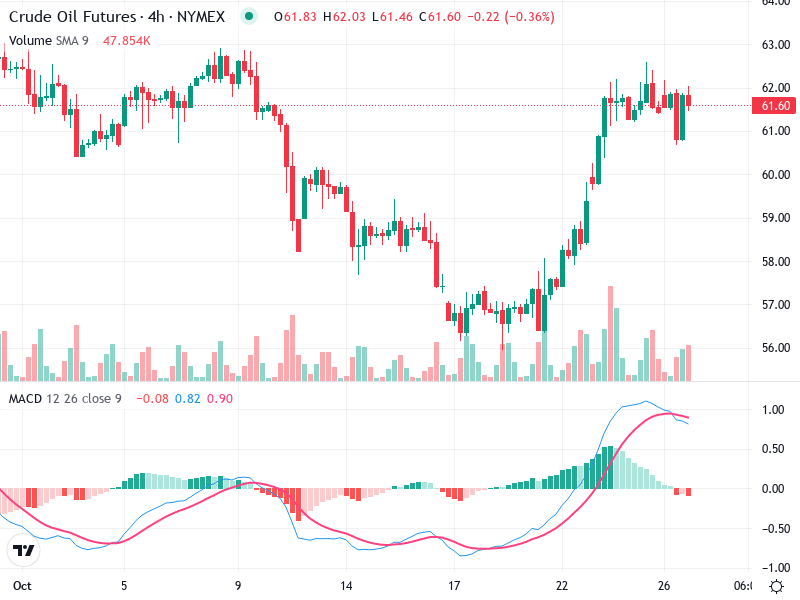
The MACD line is above the Signal line, indicating a past bullish crossover, though both lines are converging, hinting at a weakening momentum.

The MACD histogram displays declining momentum, suggesting the bullish trend is losing its strength.

No significant divergence is currently observed between price action and MACD.

Volume Analysis

A noticeable volume increase accompanied the recent price rise, indicating strength in the earlier bullish move.

The consolidation phase has seen a decrease in volume, typical during indecisive periods.

Significant volume spikes were noted at the start of the bullish trend, possibly pointing to institutional buying.

Support & Resistance

Support is found around the $60 level, where the price held during the upward move.

Resistance is strong around the $62 level, where multiple breakout attempts have been rejected.

Key breakout levels lie just above $62, with pullback zones identified around $60, acting as a support level recently.

Actionable Insights

Consider buying if the price breaks and closes above the $62 level with increased volume, confirming a bullish trend continuation.

A bearish signal might emerge if the price falls below the $60 support, particularly with high volume.

A hold strategy could be suitable as the market consolidates, pending a clear breakout signal.

The AI Technical Analysis Center is an informational tool only and does not constitute investment or trading advice.
This site is registered on wpml.org as a development site. Switch to a production site key to remove this banner.